Inside the Data: Kieran Tuntivate’s 3rd Place Finish at the Cherry Blossom 10-Miler


The Cherry Blossom 10-Miler is one of the most iconic road races in the United States, consistently attracting deep elite fields to Washington, D.C. This year, Stryd athlete Kieran Tuntivate rose to the occasion, earning a podium finish with a composed and tactically precise race.
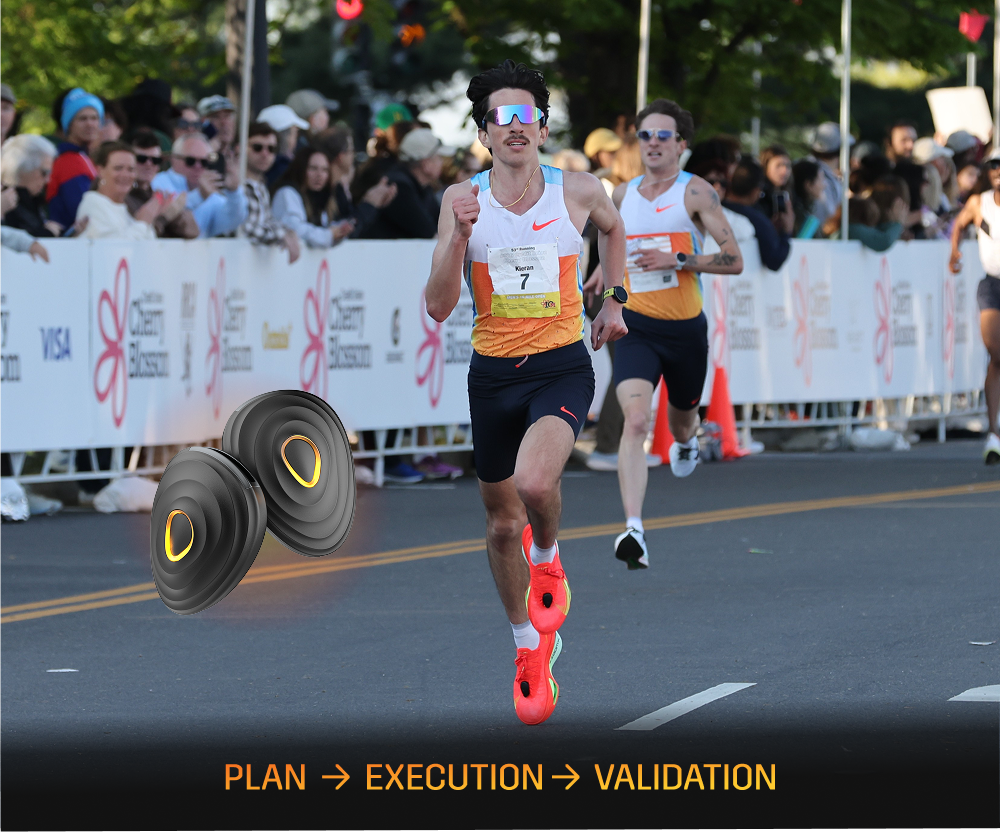
This performance was not just strong. It was intentional. From pre-race planning to final execution, every phase of Kieran’s race was guided and validated by data.
Let’s break down how it all came together.
Race Prediction: Dialed In
Before the gun even went off, the plan was already in place.
Using a 364W target baseline, built from his NYC Half Marathon performance and recent training data, Stryd’s race prediction estimated a 46:29 finish.
His actual time? 46:32.
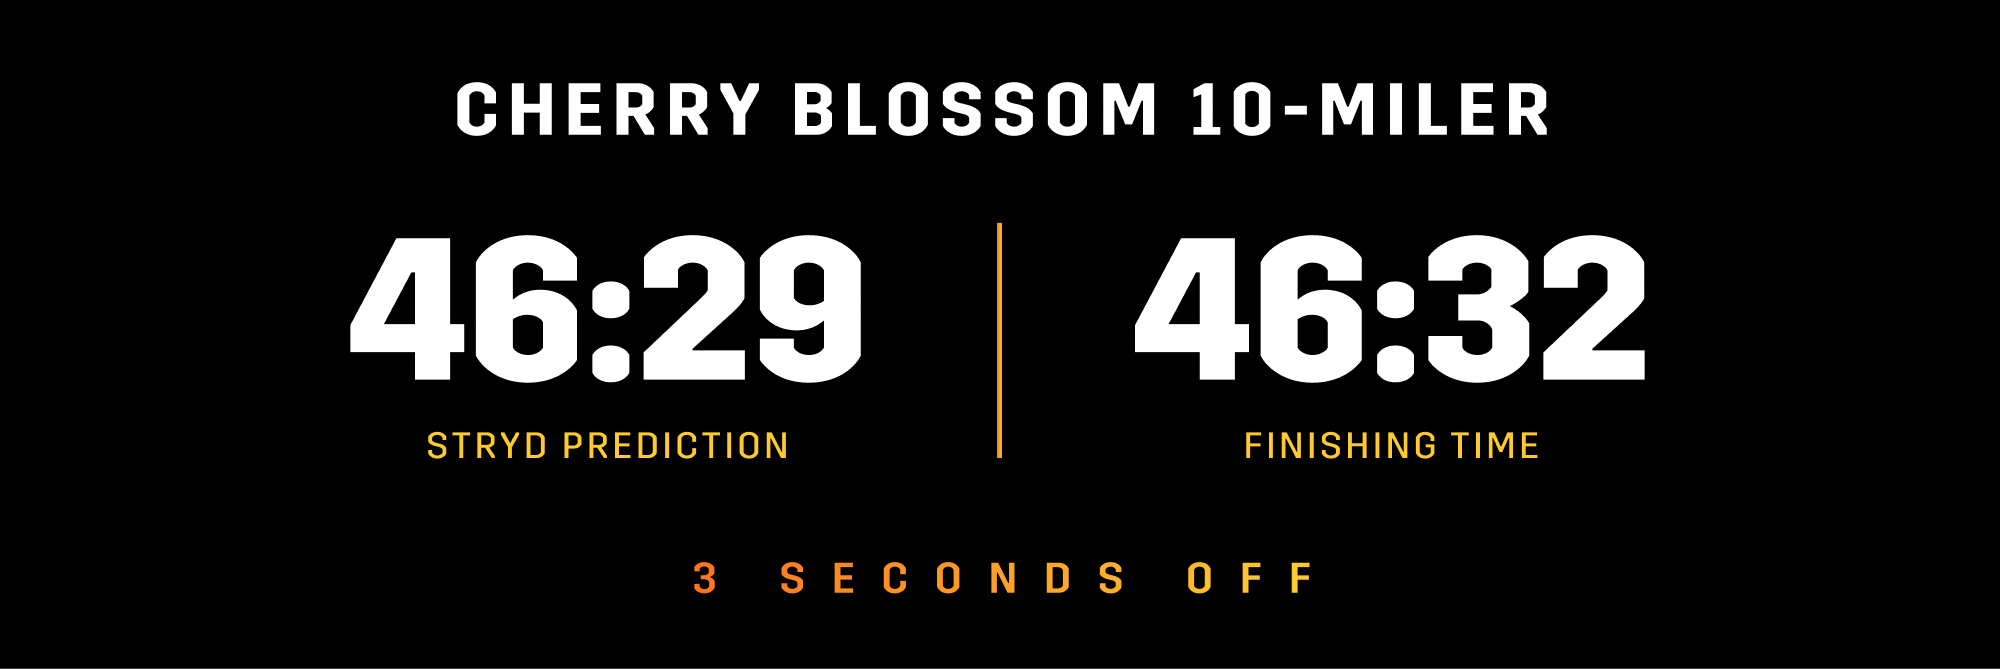
That is a difference of just 3 seconds over 10 miles.
This level of accuracy reflects more than fitness. It shows that the target was set correctly, giving Kieran a clear framework for how to approach the race. With the right number established, execution becomes the focus.
Pacing Breakdown: Tactical Execution
Cherry Blossom was a tactical race, and Kieran stayed committed to his plan from the start.

The first two 5K segments were nearly identical, separated by less than 1%. That consistency reflects disciplined pacing and confidence in the plan. Kieran stayed relaxed in the lead pack, running 2 to 3% below his target power while keeping himself in position.
In the final 5K, he began to press. Power rose to 372W, moving above target and creating a clear shift from controlled to assertive. That increase, while still tightly aligned with his plan, is what carried him onto the podium.
The result is a strong example of controlled, data-driven execution. Kieran stayed within a narrow power range from start to finish, using patience early and precision late to deliver when it mattered most.
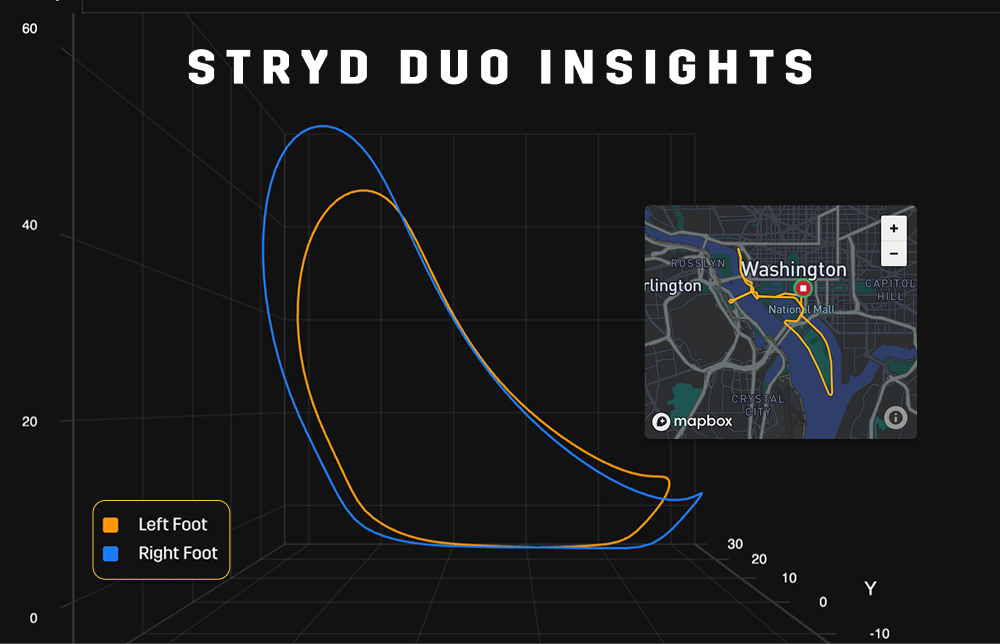
Stryd Duo Insights: What the Data Reveals
The result tells one story. The Stryd data shows what made it possible.
Stryd Duo unlocked bilateral metrics that provide a deeper look at Kieran’s performance across three key areas.
Taper Confirmation
Kieran’s Leg Spring Stiffness (LSS) exceeded 11 in the opening 5K, which for him, is a strong signal that his taper was effective. Elevated LSS early in a race indicates the legs are fresh, responsive, and ready to perform.
Durability Under Fatigue
Just as important is what happened over the full race. Kieran’s LSS dropped by less than 3%, from 11 to 10.7 in the final 5K.
Maintaining stiffness this well under race conditions points to real durability. It shows his marathon-focused training is translating into the ability to sustain efficient mechanics deep into a race.
Balance and Asymmetry
Stryd Duo also captured slight asymmetries in Impact Loading Rate (ILR) and LSS, with marginally higher impact on the right side and correspondingly lower stiffness. These differences remained within Kieran’s normal range.
Tracking these patterns over time provides actionable insight, helping guide training decisions, manage load, and support long-term development.
The Power of Data-Driven Racing
Kieran’s performance highlights a complete progression from plan → execution → validation.
The prediction set the target.
The pacing delivered the result.
The Stryd data explained why it worked.
Together, this creates a full picture of performance, going beyond finish time alone.
With marathon training continuing to build durability and power trending upward, Cherry Blossom looks less like a peak and more like the first signal of what is building.