
Why Mechanical Load Deserves Its Own Score


Free download for the Stryd community: The Calf Gym Strength Plan. A targeted strength program designed to build the structural resilience your calves and Achilles need for high-load running.
👉 Download for free here
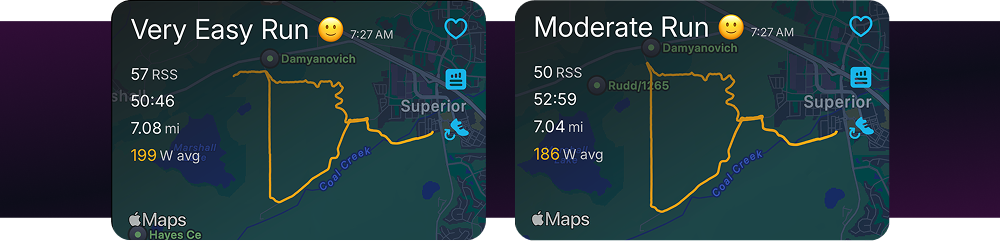
I ran the same route twice last week. Saturday was easy at 7:45 pace. Next Friday, I pushed tempo at 6:50 for 7 miles.
Both runs showed up in my training log looking similar. Similar distance. Same route. Similar calorie burn. But my body told a very different story.
Two days after Friday's tempo, my calves and Achilles were still talking to me. Saturday's easy run? Gone by dinner.
Heart rate explains part of it. Friday was harder metabolically. My cardiovascular system worked harder to deliver oxygen.
But heart rate doesn't explain why my calves bore the brunt. The cardiac stress wasn't what left me sore. It was the forces transmitted through my muscles and tendons with every stride.
This is the gap I didn't notice until I had both numbers in front of me. There are two kinds of training load, and your watch only tracks one of them.
Metabolic load is the cardiovascular and energy system cost of a run. Heart rate, oxygen consumption, caloric burn. Your GPS watch does a reasonable job here.
Mechanical load is the structural cost. The forces your bones, tendons, and connective tissue absorb each stride. Your watch ignores it entirely.
These two don't move in lockstep. A run can be metabolically moderate and mechanically brutal. Understanding the difference changes how you manage training.
Why Mechanical Load Deserves Its Own Score
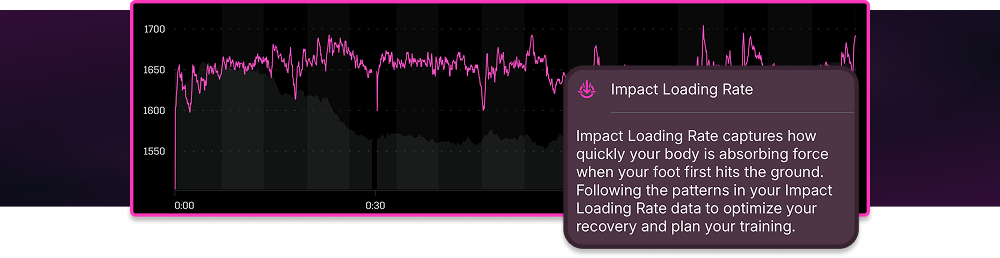
Every footstrike generates impact forces that travel up through your ankle, tibia, knee, and hip. The harder you run, the higher those forces climb. But it's not linear.
Impact Loading Rate (the rate at which ground reaction forces build during initial contact) rises with speed. Each step at a faster pace delivers a higher peak load.
But the critical insight is what happens when those higher loads accumulate.
Tissue damage doesn't scale evenly with force. Double the per-step load causes more than double the damage.
The relationship is exponential, which means cumulative damage to the Achilles and patellofemoral joint climbs much faster than distance alone would suggest.
Research by Bas van Hooren (2024) modeled this across speeds, showing that cumulative damage rises with speed even though you take fewer steps per mile.
Applying a similar framework, John Davis estimated that for one modeled runner, Achilles damage per mile at 5:20/mi was roughly 5.7 times higher than at 9:00/mi.
Fewer steps. Far more damage per step.
Speed doesn't just cost more metabolically. It costs more structurally, and at a steeper rate.
This is likely why tissues break down in specific patterns. Stress reactions and tendon overload appear to track more closely with accumulated mechanical load than with weekly mileage alone, especially when that load spikes suddenly.
Separating the Metabolic From the Mechanical
Stryd gives you both sides of the equation.
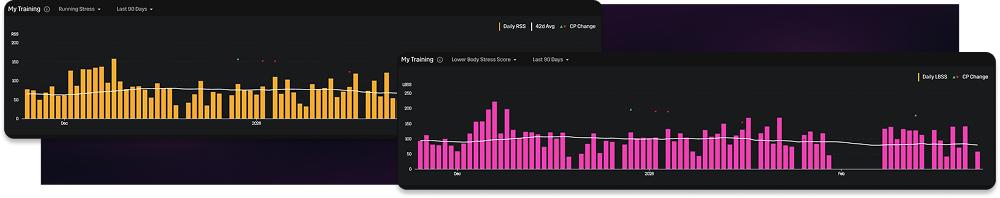
Running Stress Score (RSS) captures the metabolic side. It scores how long and how hard you ran relative to your Critical Power. One hour at CP gives you roughly 100 RSS. Think of it as how much your cardiovascular and energy systems worked.
Lower Body Stress Score (LBSS) captures the mechanical side. It accumulates your Impact Loading Rate (ILR) relative to your Critical Impact, which is your ILR when running at CP on flat ground. One hour at Critical Impact gives roughly 100 LBSS. Think of it as how much structural stress your tissues absorb.
Here's where it gets interesting. On my easy 7-miler (Tuesday), RSS and LBSS were roughly proportional. Easy effort, moderate structural load. No surprises.
On Thursday's tempo? RSS was higher, as expected. But LBSS jumped disproportionately.
The structural cost of running 6:45 pace was not just "a bit more" than 8:30 pace. It was roughly double.
Same distance. Same route. But the mechanical load curve steepened dramatically with intensity.
This is the gap your watch misses. Heart rate and pace gave me one dimension of that Thursday run. LBSS revealed the structural toll hiding behind a simple "tempo" label.
When the Mismatch Matters Most
The gap between metabolic and mechanical load isn't just interesting. It's practically useful.
Three scenarios where LBSS tells you something RSS can't:
- Downhill running. Metabolically easier than flats. Mechanically punishing. Eccentric forces on your quads spike on descents. Loading at the knee and patellofemoral joint climbs markedly. The run feels easy, but vertical impact peaks tell a different story. LBSS captures this. RSS doesn't.
- Speed work after a volume block. You've built aerobic capacity with easy miles. Your metabolic fitness is sharp. But your tissues haven't been exposed to high-force loading. Jumping into fast intervals without building mechanical tolerance is a well-recognized trigger for structural overload.
- Surface changes. Switching from trails to roads, or from a track to concrete, changes the impact profile of every stride. Similar metabolic cost. Different mechanical costs.

What to Do With This
I track two numbers after every key session, and I watch them together. Here's the framework.
- Check LBSS after every key session. Not just RSS. If your tempo run scores 2x the LBSS of your easy run at the same distance, that's serious structural load. Plan recovery accordingly.
- Watch the LBSS-to-RSS ratio over time. When LBSS spikes without a corresponding RSS increase, something changes mechanically. Faster pace, harder surface, steeper terrain. Your watch says "easy week." Your tissues say otherwise.
- Build mechanical tolerance using LBSS as a guide. Before adding a speed block, look at your trailing LBSS trend. If recent weeks have been low-LBSS easy volume, introduce faster sessions gradually. Watch LBSS climb over 2-3 weeks rather than spiking in one session.
- Use LBSS to audit your training week. Sort your weekly runs by LBSS, not just mileage or duration. I've caught weeks where a hilly long run and a fast finish drove LBSS to its highest point in a month. The mileage looked normal. The structural load didn't.
- Pair high mechanical load with targeted strength work. If your LBSS data reveals that your training demands serious structural capacity from your calves and Achilles, a dedicated strength program closes the gap between what your training demands and what your tissues can handle.
Next time your legs are sore after a session that felt easy, check the LBSS.

Free download for the Stryd community: You just saw what LBSS reveals about the mechanical cost of fast running. The Calf Gym Strength Plan builds the structural capacity your calves and Achilles need to handle it.
Sources:
- van Hooren, B., et al. (2024). "Per-step and cumulative load at three common running injury locations: The effect of speed, surface gradient, and cadence." Scandinavian Journal of Medicine & Science in Sports, 34(3), e14594.
- Davis, J. (2025). "Understanding tissue loading, tissue damage, and running injuries." Running Writings.