
Insights in the Stryd Android app are here | Learn more from every run


Are you looking to spot trends in your data — without sifting through all your activities?
Do you want simple insights that help you learn more from every run?
Do you want these insights to be served to you automatically after every run?
Today, we are launching a major update to the Stryd Android app that delivers advanced and automated insights from your Stryd data.
Let's take a look at the new insight cards in the Stryd Android mobile app.
Note: These features are being introduced to the Stryd Android app today and are currently available in the Stryd iOS app. Be sure to update your Stryd mobile app to the latest version via the Google Play Store or Apple App Store in order to access insight cards.
Stryd on the Google Play Store >> (version 7.3+)
Stryd on the Apple App Store >> (latest version)
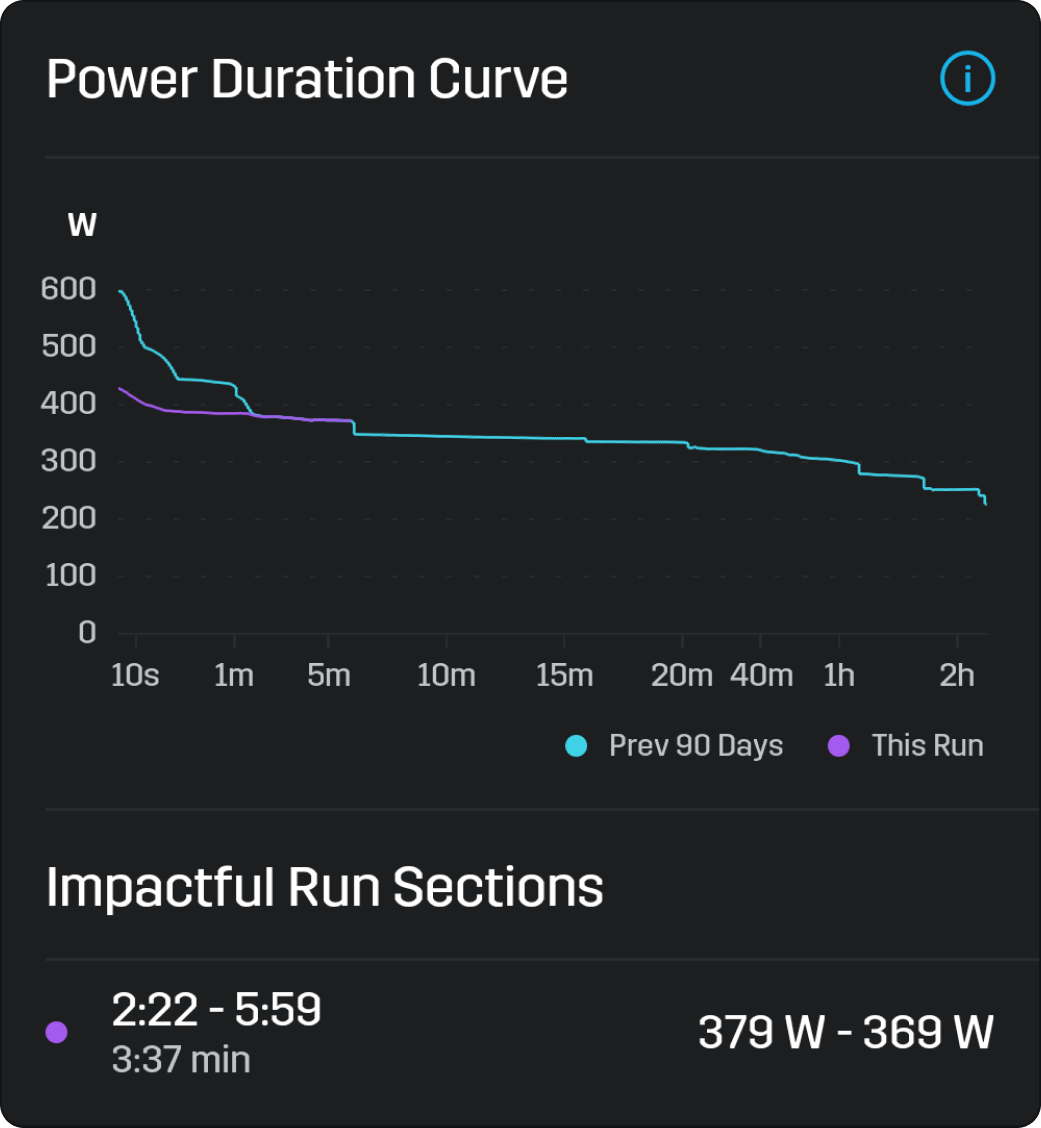
Identify impactful runs with the Power Duration Curve card
With the Impactful Run Sections in the Power Duration Curve insight card, you can quickly identify runs that are near or exceed your personal best performances.
This card provides visualization on how each run uniquely contributes to your current fitness & auto-calculated Critical Power.
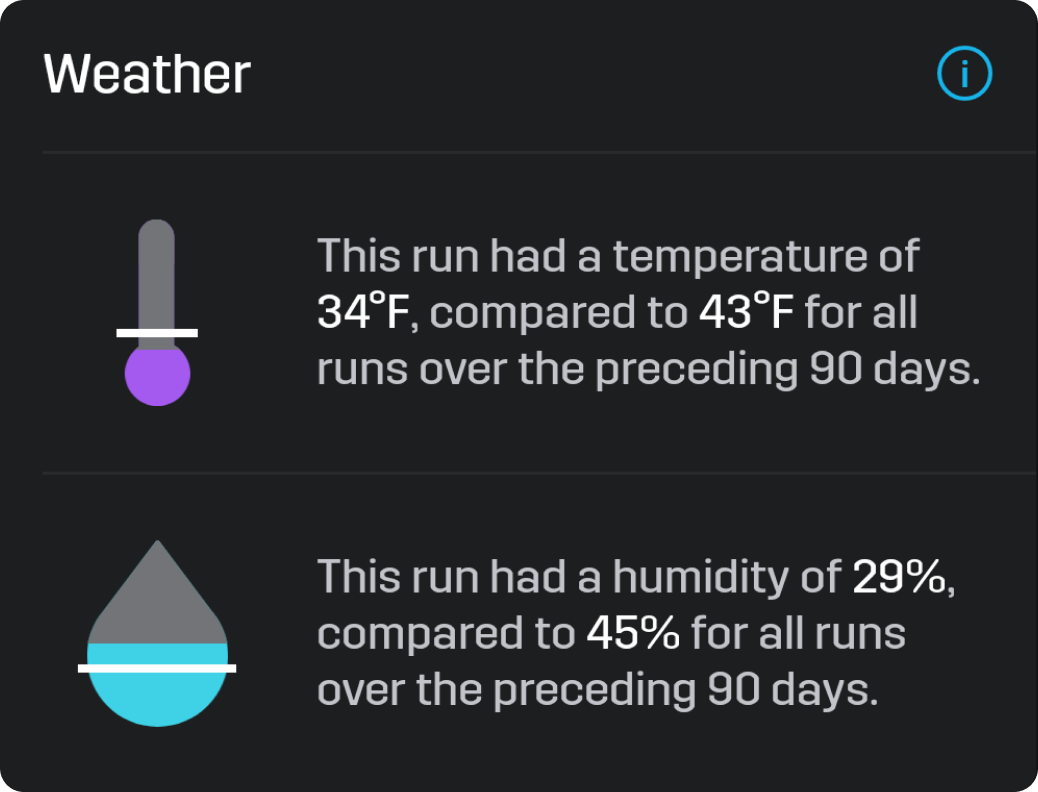
See how temperature and humidity impact your run with the Weather card
How does your performance change with the seasons?
You can identify if shifting temperatures are having an impact on your performance by checking the temperature and humidity insight.
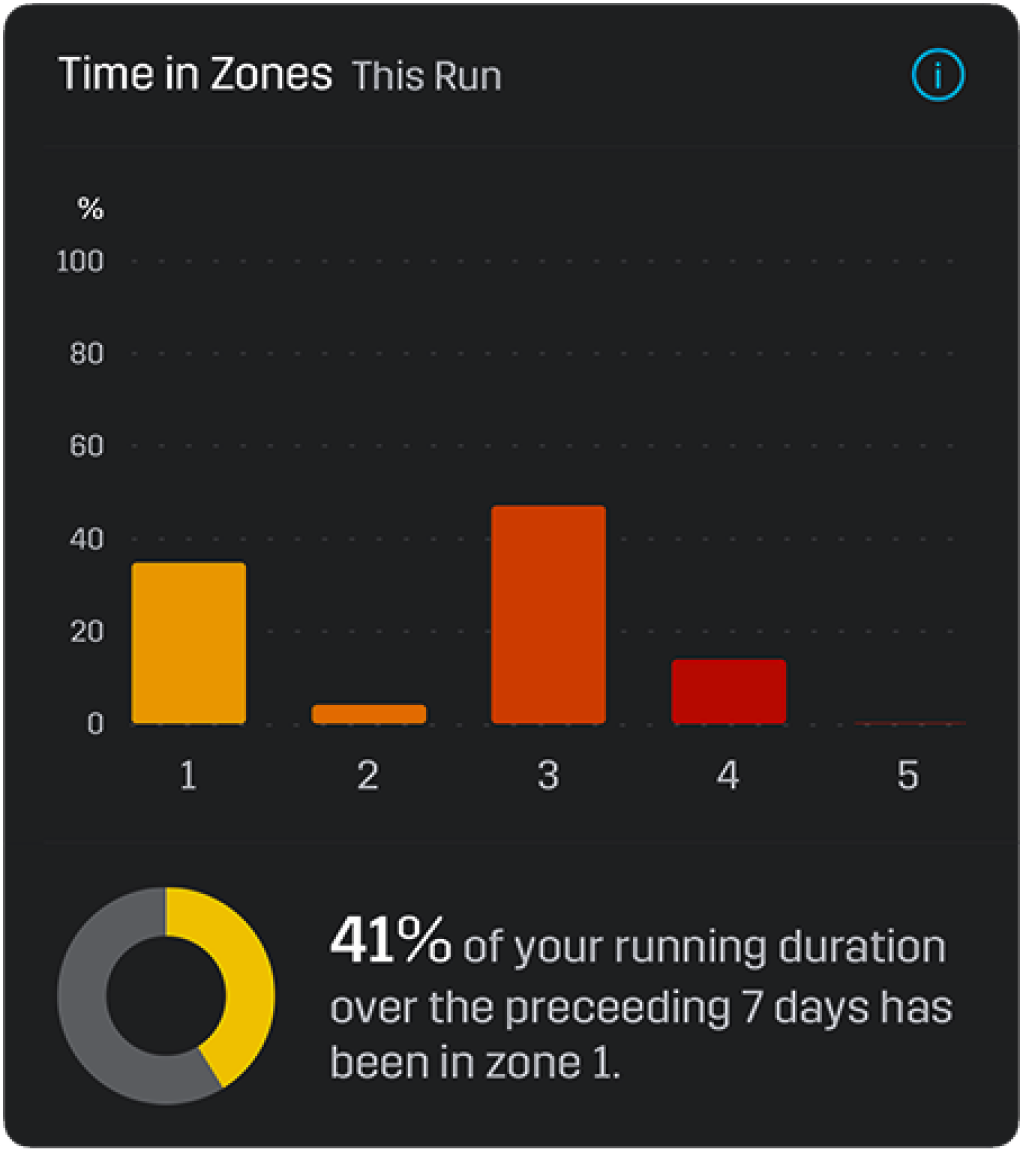
See your training distribution with the Time in Zones card
Are you spending your training time effectively? Now, it is easy to figure that out with the Time in Zone card.
You receive a breakdown of how your effort distributes across each of your five power zones.
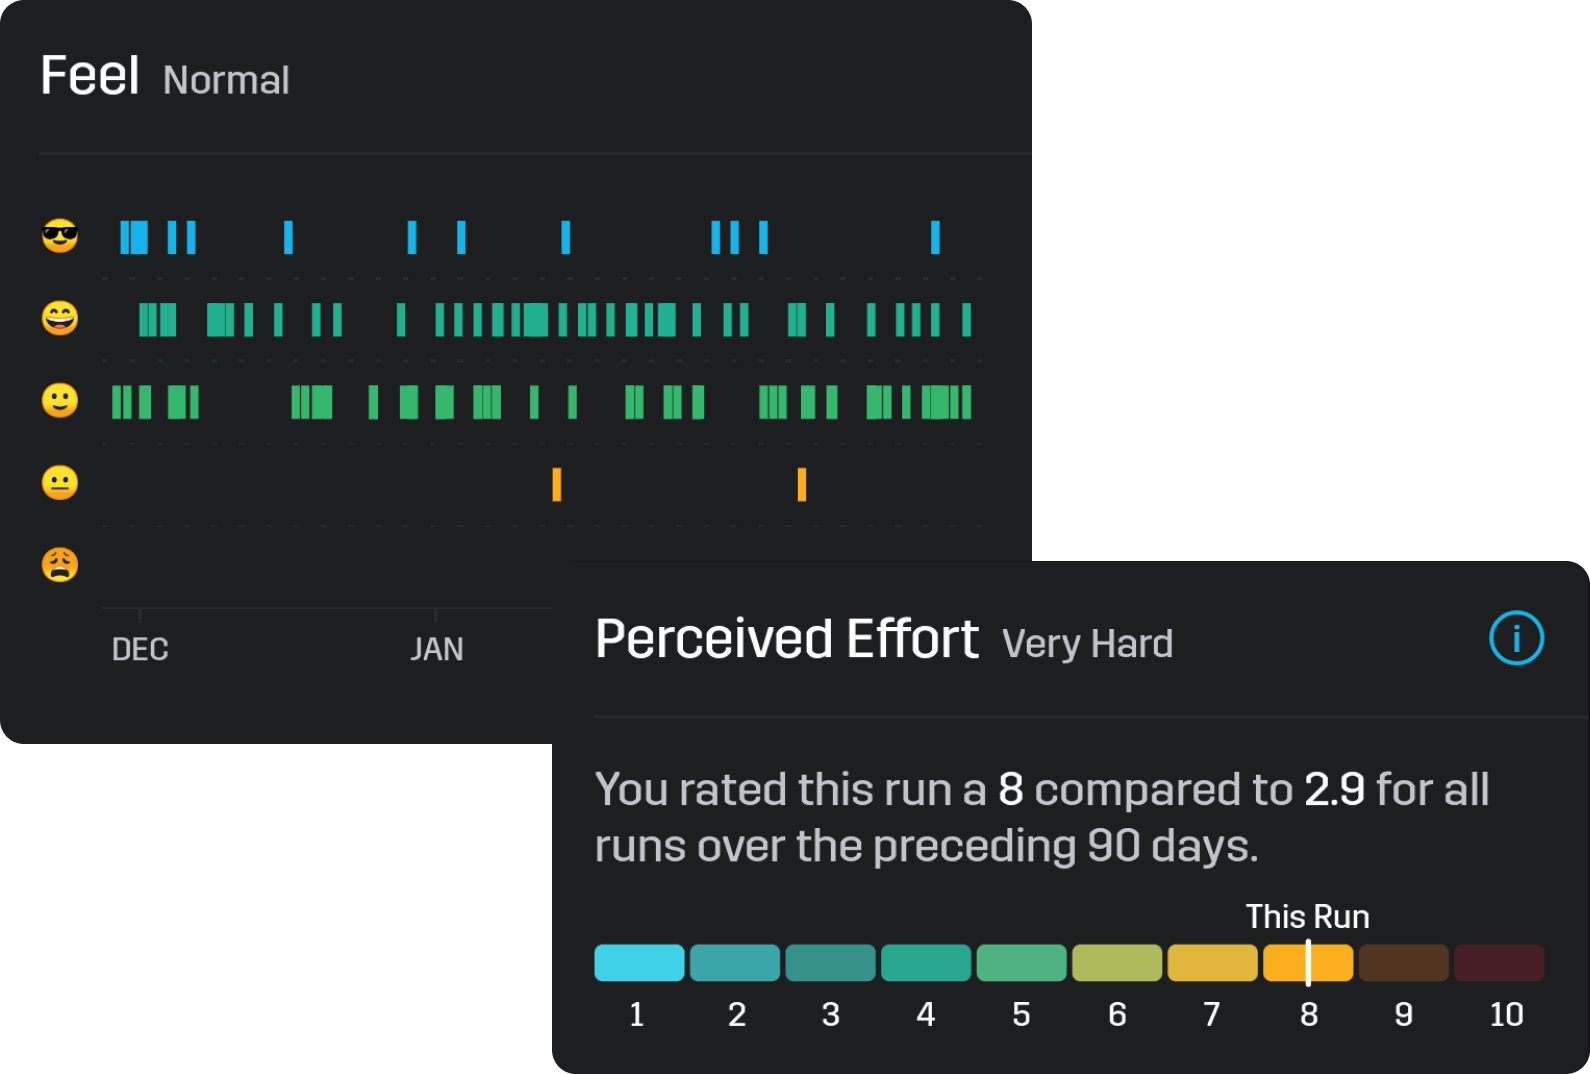
Visualize the impact of your training with Feel & Perceived Effort cards
How well are you handling your training? Has it been too easy? Too stressful?
Feel & Perceived Effort cards let you quickly visualize how each run has left you feeling in order to spot under & over training trends.
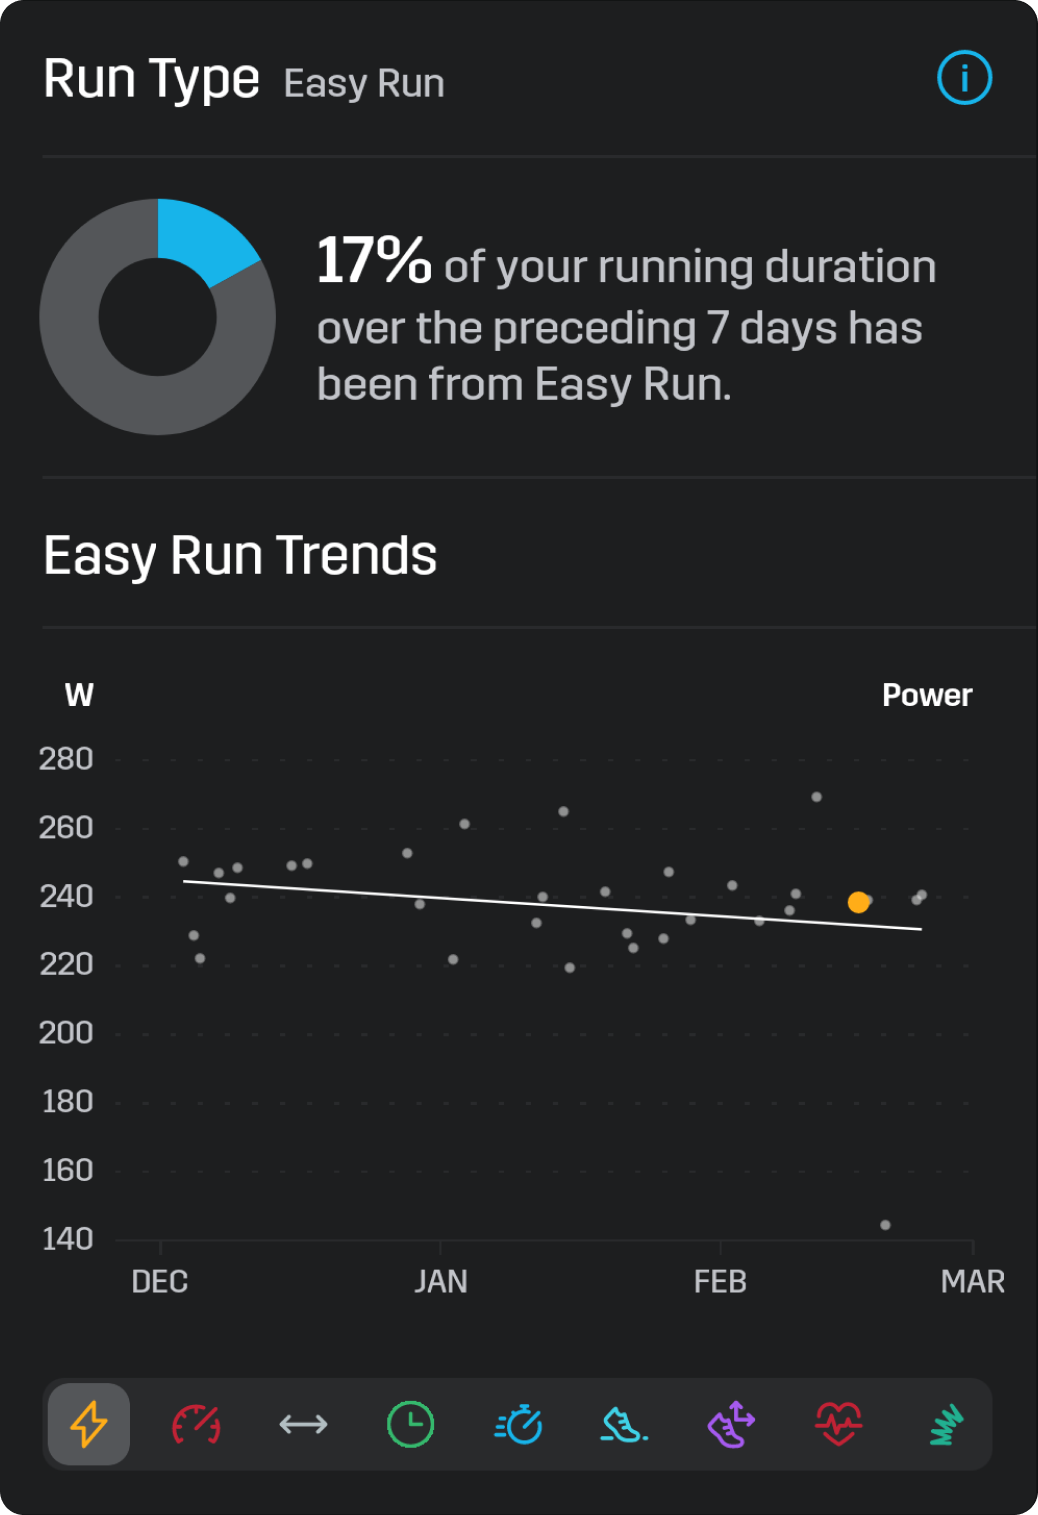
Monitor your progress with the Trend card
The easiest way to quantify & identify your progress is to use the Trend card.
You can quickly see your progress for any of Stryd’s metrics across all run types including easy runs, long runs, recovery runs, and more!
Note: Tag your runs with a given run type to access your running trends.
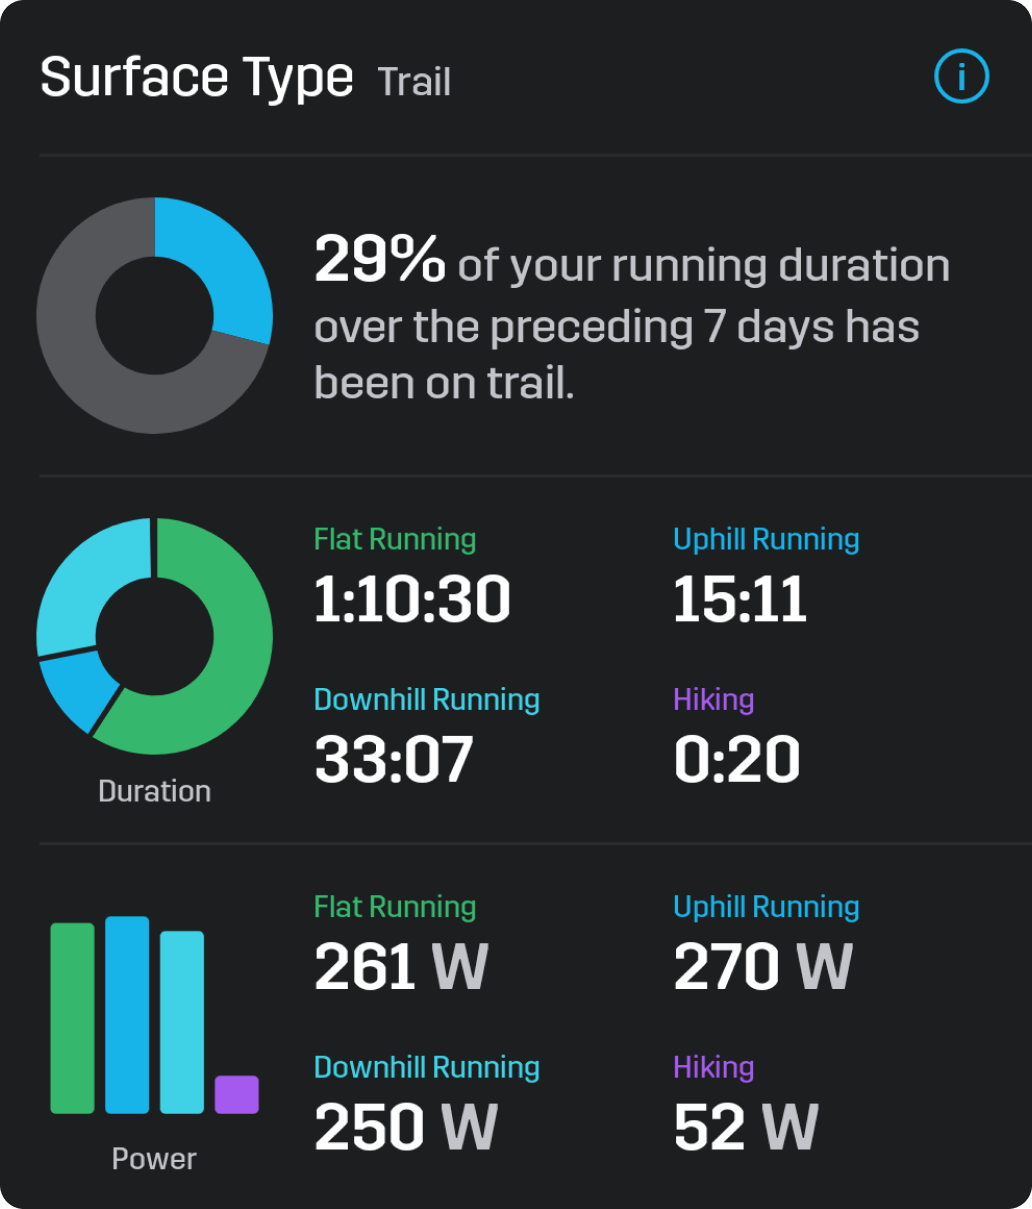
Quantify your training tendencies with Surface Type & Trail Surface Type cards
Did you know that 50% of your recent training has been uphill long runs on trails
Or, that 25% of your training time has been flat easy runs on grass?
You can break down training efforts across surface types and receive additional details for trail runs to learn how you handle different types of terrain.
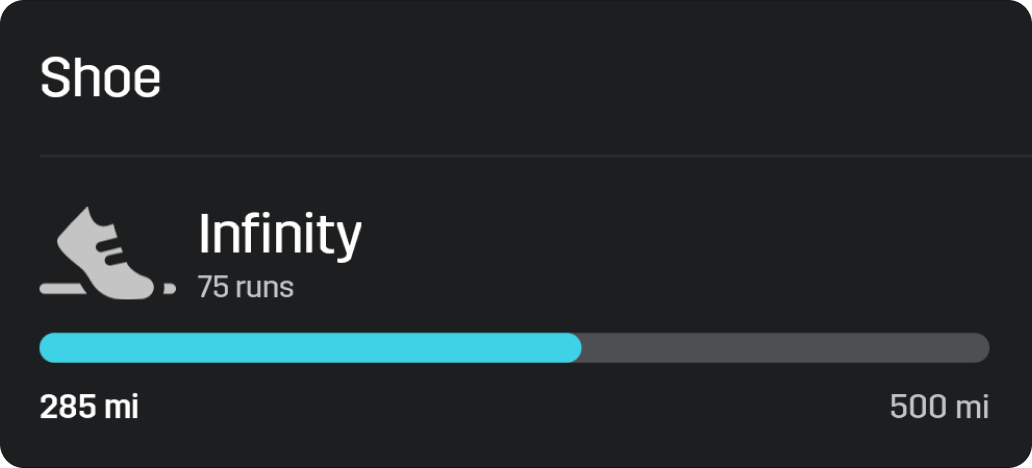
Track your shoes and their lifespan with the Shoe Mileage card
Every shoe has a lifespan. Don't risk missing your best performance or unnecessarily risk injury by running in expired and worn-out shoes.
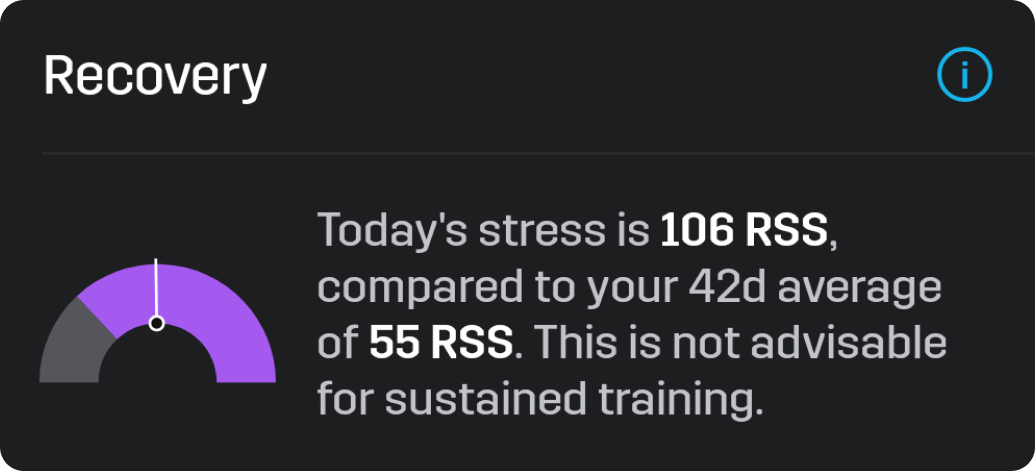
Sustain your training with the Recovery card
Is your recent training sustainable or are you pushing too hard into a risky overtraining zone?
The Recovery insight card shows how your training session compares against other recent sessions, in terms of stress, so you can spot over or under training risks.
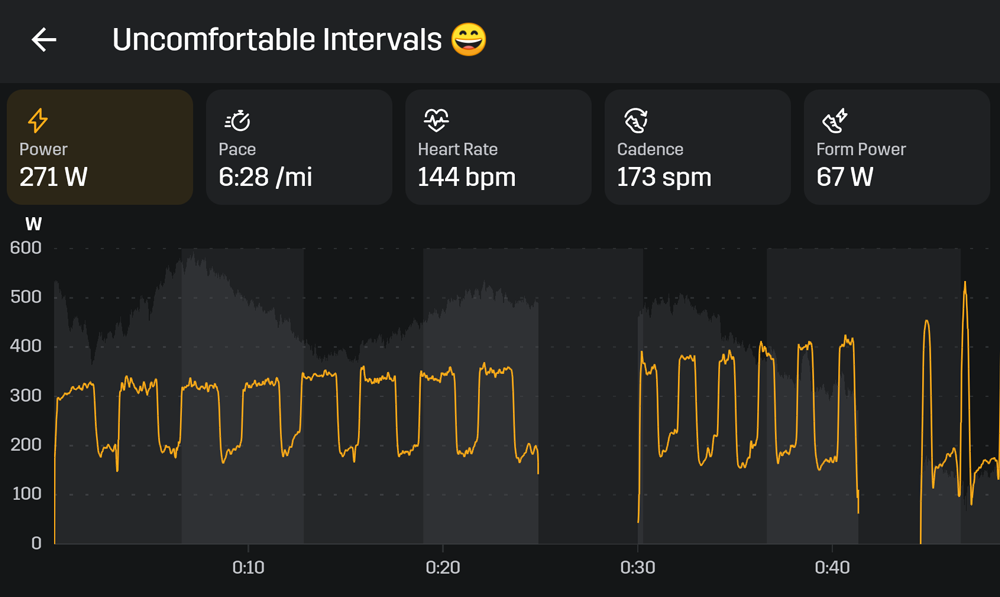
New: A full screen view into your Splits & Graph
In addition to the new insight cards, this update also includes a full screen view into your splits and your graphs.
Your data expands to fill your entire screen so you can go in-depth into your run!
Getting Started
In order to get started with insights, you first need to tag your activities!
See this article for instructions on how to tag activities >>
After you tag your activities, you will find new insights cards when you select a run in your Stryd mobile app.
Note: You may not receive every insight card for every run. Insights are uniquely assigned to each run based on what kinds of tags that run has. Add as much information to each run as possible to receive as many insights as you can!
Live Demo
When: Tuesday, March 10 @ 1PM MT (GMT-7)
Where: Youtube: https://youtu.be/-Yiy8xvdHmQ
Why: Evan Schwartz from the Stryd Team will show you his favorite insights cards and how he uses them in training
Final Word
You did the hard work by completing the training and collecting the data. Now, let Stryd find the meaningful insights!
We hope that these insight cards will help you find the important commonalities in your data to make post-run analysis easy.
If you already own Stryd, enjoy this feature as part of the free preview of the new Stryd membership from today until the first half of 2021.
Then, join the discussion on the Stryd Community >>
Best,
Stryd Team