
Closer Look: Discover the key patterns that are boosting your fitness with Stryd’s trends


You will be able to discover the key patterns that are boosting your fitness — and be able to correct the ones that are holding you back — with the help of new trend graphs and filtering options in the Stryd mobile app.
Let's take a look at the new features!
Note: Trends have arrived to the Stryd iOS mobile app first. This feature will come to Android later.
See which of your metrics are improving with Metric Trends
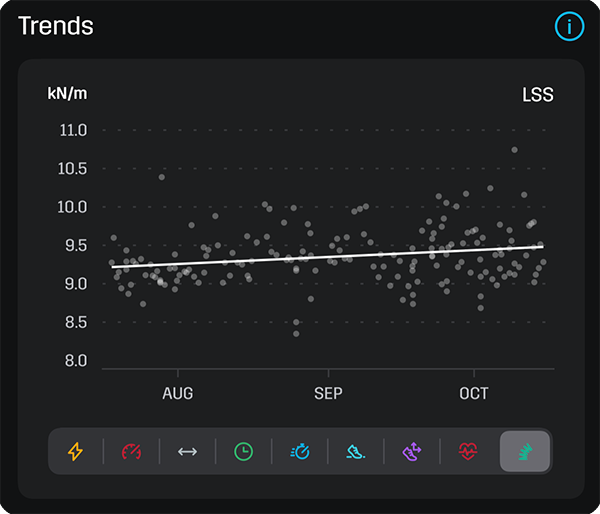
You can quickly flip through trends for all of your Stryd metrics to see which are improving.
The trend graph shows averages for power, pace, ground time, vertical oscillation, heart rate, and Leg Spring Stiffness for each run. You can also see training load, distance, and duration for each run.
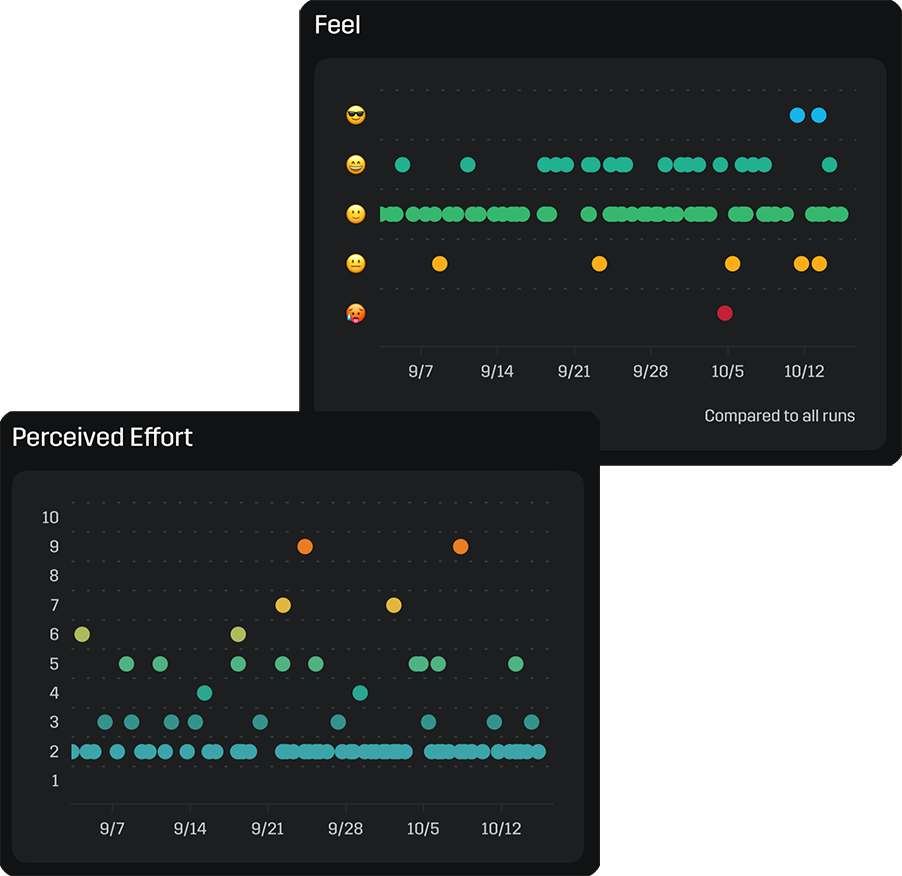
See if you are pushing too hard with Feel & Perceived Effort Trends
Is your run training leaving you utterly exhausted? Are you regularly pushing past your limits?
Now, you can quickly identify if you are overexerting yourself with the Feel & Perceived Effort Trends. You can use this information to tell you when you should back off or when you need to push harder in your training.
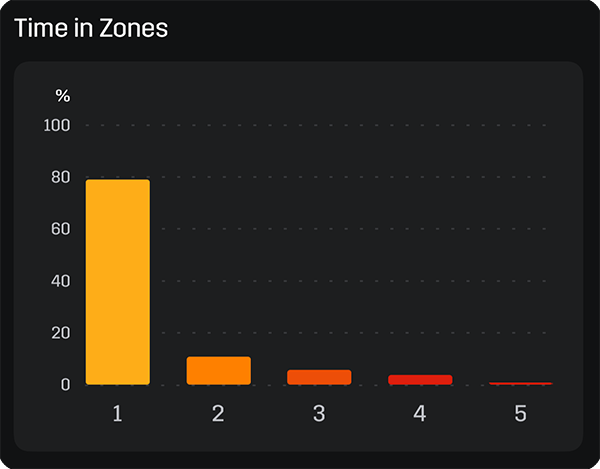
See your training distribution with Time in Zones
Are you spending your training time effectively? Now, it is easy to figure that out with Time in Zones.
In the Trend view, you will see how you spent your training effort during the last 90 days.
All of these Trend charts become even more useful when you combine it with the next feature...
Filtering brings a higher degree of precision & meaning to your analysis
We have saved the best feature for last: filtering!
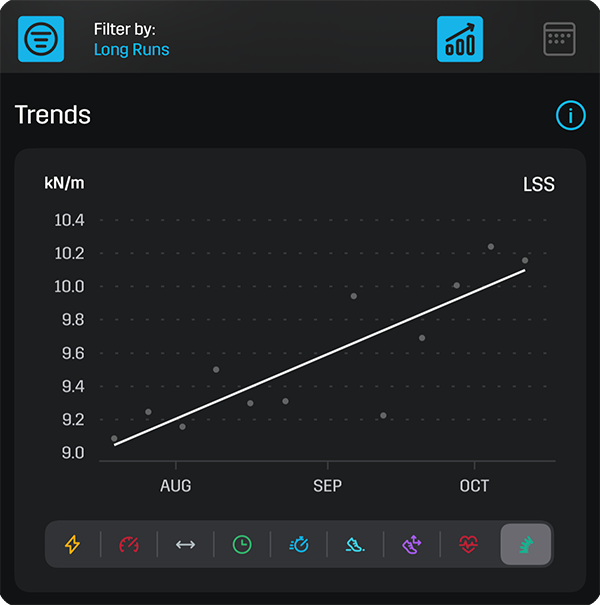
With filtering, you can narrow in on specific types of runs to see how those runs are trending.
Let's look at a use case:
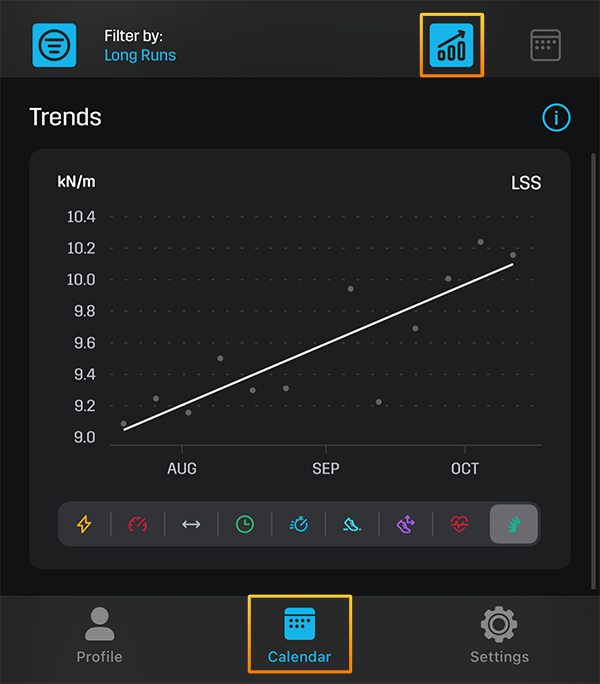
First, let's filter by long runs. Is your average power output, duration, or Leg Spring Stiffness trending upwards or downwards during these activities?
If those metrics are trending downwards, you can discover why that is.
Is it because you have been pushing your easy runs too hard in the days before your long runs? We can find out!
Next, let's filter by easy runs and look at the Perceived Effort & Feel chart. If those metrics are high, that could be indicative that you are pushing your easy runs too hard which could be negatively impacting your long run ability.
With these two filters, you have learned that you likely can perform better on long runs by backing off on easy runs for more complete recovery.
Getting Started
In order to get started with trends, you first need to tag your activities!
See this article for instructions on how to tag activities >>
After you tag your activities, you will find more trends inside of the Stryd iOS mobile app.
How to access trends inside of the app:
1. Go to the Calendar tab in the iOS app
2. Tap on the Trend tab in the top right corner of the app
When: Thursday, October 15 @ 3PM MT (GMT-6)
Where: Youtube: https://youtu.be/UkdVz_4Udlo
Why: Evan Schwartz from the Stryd Team will show you how he analyze his running data using these new trend graphs and filtering options
Final Word
We built all of these new features to help keep you in the 'sweet spot' during run training.
You can have confidence that you are in the 'sweet spot' if your fitness is moving in the right direction with trends — and you also receive crucial information you can use to correct your training if it is not moving in the right direction!
If you already own Stryd, enjoy the free preview of the new Stryd membership from today until the first half of 2021.
Join the discussion on the Stryd Community >>
If you don’t yet own Stryd, you can purchase Stryd here and enjoy free membership benefits until the first half of 2021.
Order Stryd here >>
Best,
Stryd Team