
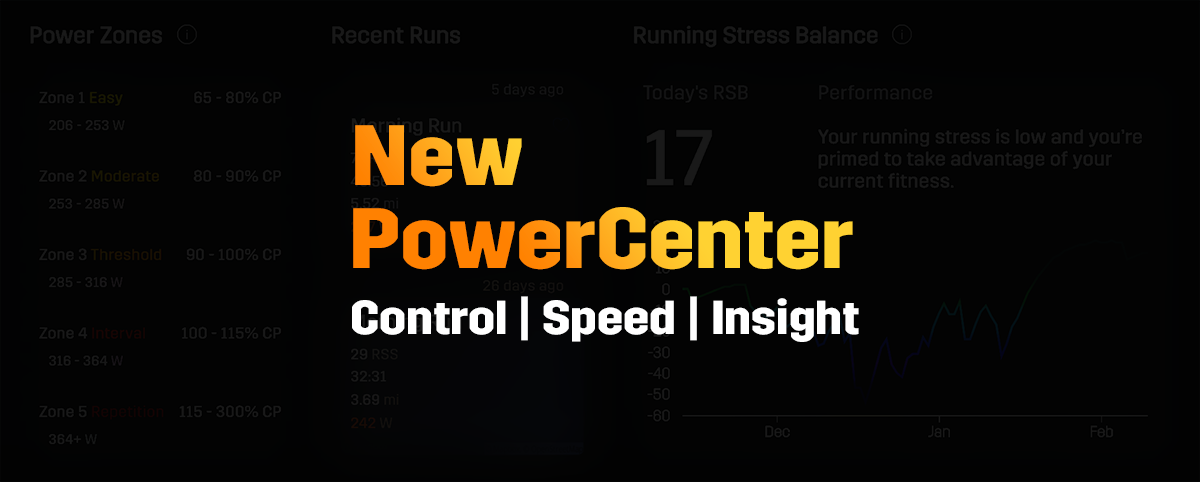
Introducing the new PowerCenter - New Stryd Power Analysis Platform

The new PowerCenter lets you extract more insight out of your pre-existing running power data in as few clicks as possible.
You are going to love this update because you will be:
- a smarter data analyst that has fun discovering new insights about yourself in your data
- a faster racer who executes your A-races armed with perfect knowledge of your capabilities
- a methodical trainer who can optimize your daily training plan in pursuit of your running goals
IMPORTANT: Before you visit the new PowerCenter and begin to enjoy this great update, please read this entire post.
This post contains instructions on:
- How to get support if you have questions
- What kind of features you will expect to see in this update
- What you should do if you enjoy this update
If you follow our instructions, you will get the best answers and support to your questions.
Plus, you will have a better understanding of what you are receiving so you will enjoy the features far more.
This is extremely important to follow the instructions since this is our biggest update ever!
Got that?
Let’s carry on!
The fun is about to begin.
Here are three things we made great in the new PowerCenter
- More control
- More speed
- New insights
Let’s jump into these features.
1. More Control
Wield complete control over your data with fine grained selection over time ranges: such as individual laps, days, weeks, months, and even years worth of data.
When you run with Stryd, you collect over three thousand power data points over a single one hour run.
Let’s extend that single run into many runs.
You can have ten thousand power data points per week.
And, over half a million power data points per year.
Some of our long time Stryders have millions and millions of power data points now.
How do you control that volume of data and make those millions of data points useful to you?
You need to have complete control of your data.
Now, it is easy with the new PowerCenter.
Quickly analyze individual laps
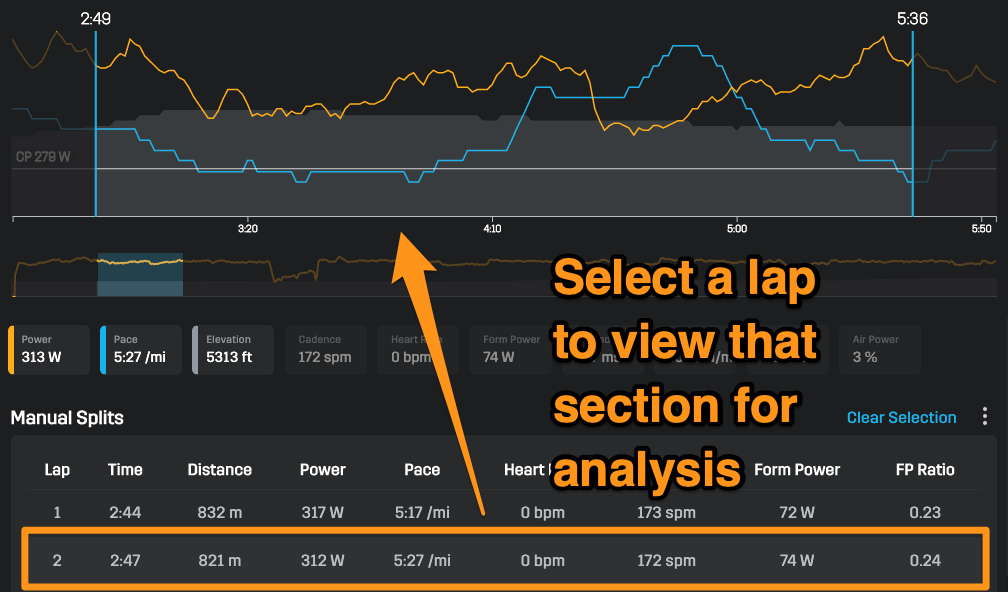
By clicking on a lap, you can precisely analyze that lap in detail. This makes it far easier to analyze interval sessions, long steady state runs, and any type of run with many lap markers.
See how the texture of your training has changed over time with Power Duration Curve comparisons
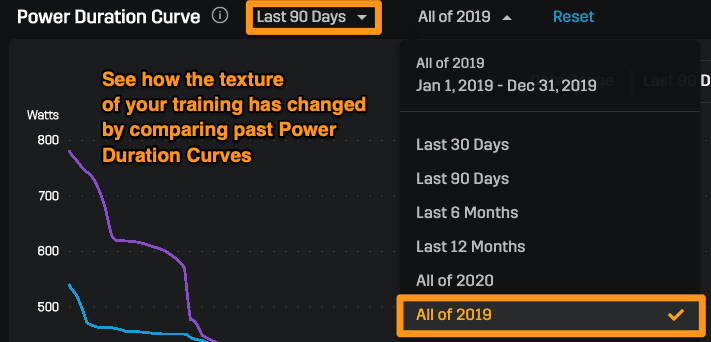
You can now compare your Power Duration Curve over time by selecting two separate time windows. This feature can be valuable to see what kind of maximum effort sessions you performed and how those performances compare against your current capability.
See how your fitness has evolved with historical Critical Power
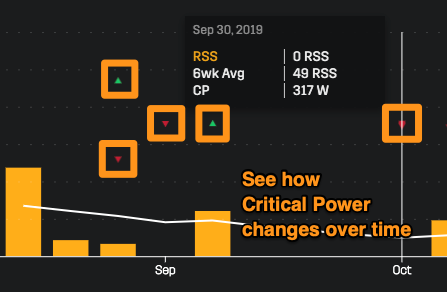
Now, you have a complete record of how your overall fitness has changed over time with a log of increases/decreases to your Critical Power. This record can be valuable in identifying what workouts lead to Critical Power improvements.
View your stress/rest balance over time with Running Stress Balance
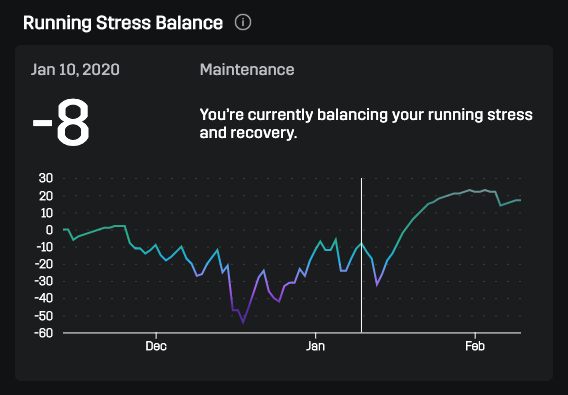
A record of Running Stress Balance helps you identify heavy and light stress periods of training. It can also act as a trend to identify when you are best primed for an all-out race effort.
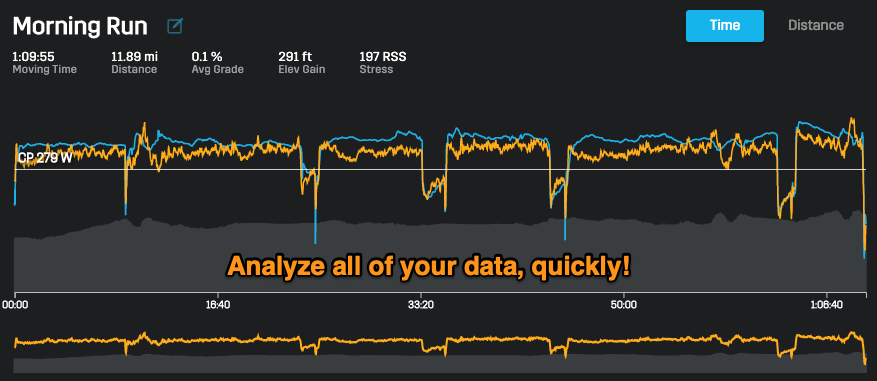
View Stress Load and Averaged Stress in the "My Training" chart
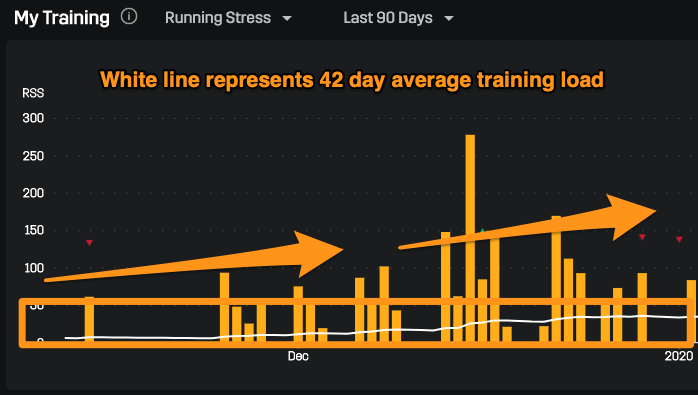
On the "My Training" chart, the white line averages your last 42 days of stress scores.
You can use this white line as an indicator of your ramping or decreasing training load.
The orange bars represent training load from each run activity, in terms of Running Stress Score.
Before we continue on to more great features...
Do you have any questions? Follow these instructions to get an answer.
It is important to send your question to the right channel so you get a good answer quickly.
Case #1: If you simply need more information on the new PowerCenter, read the knowledge base & FAQ.
We have created a comprehensive knowledge base that explains the new features of the new PowerCenter in-depth. You can read through this knowledge base if you desire to learn more. You can find that here: https://help.stryd.com/
Case #2: If you want to know how something works, post in the community.
If you have a question on how a new feature works...if you need help interpreting your data...if you want to share your findings on the new insights provided in the new PowerCenter…
Please create a post in the Stryd Community on Facebook: https://www.facebook.com/groups/strydcommunity/
This will let others learn from your question and this interaction will empower other Stryders with info!
Case #3: If something is broken, email our support team.
If something is broken...if you cannot access the new PowerCenter...if your data looks wrong/weird...
Please send us an email at support@stryd.com. Our support team will need to help fix your account or report the bug to our developers so it can be fixed.
Great! Let’s continue on to more features.
2. More Speed
Enjoy your data analysis experience with blazing fast & easy-to-understand controls.
The new PowerCenter is a pleasure to explore because it is faster, there are more help dialogues, and the controls are more intuitive.
You will be excited to click around and find that the new PowerCenter instantly serves you the content you are looking for.
Information buttons explain all the features in detail
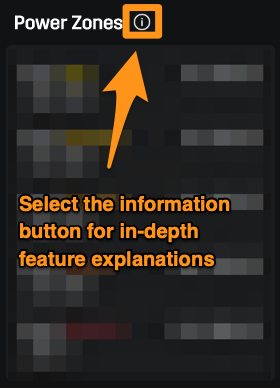
If you are ever curious about how a certain feature works, look for the information button! The information button will load an article with an in-depth explanation of what you are looking at.
New PowerCenter works on big screens… and small screens
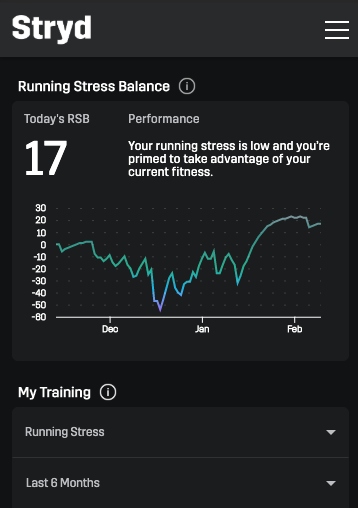
When you are on the go, you can load up the new PowerCenter in your mobile web browser. The new PowerCenter is a great compliment to the analysis tools offered in the Stryd mobile app.
Activities load for analysis much quicker
We have optimized the new PowerCenter for speed so you can jump from analyzing one activity to the next quickly.
3. New Insights
Discover previously-unseen insights from your existing data.
We have a suite of new analysis tools that let you see your existing data in a new light. This will lead to the discovery of previous-unseen insights to get more out of the miles you have already put in!
Compare your skills against runners like you in the Stryd Community
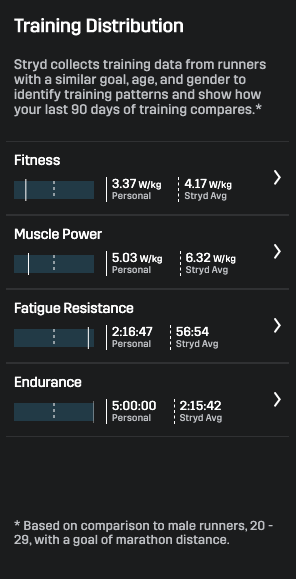
Stryd compares your training data against runners with a similar goal, age, and gender to show how your last 90 days of training stack up.
Compare your recent training against your Critical Power in the Fitness view
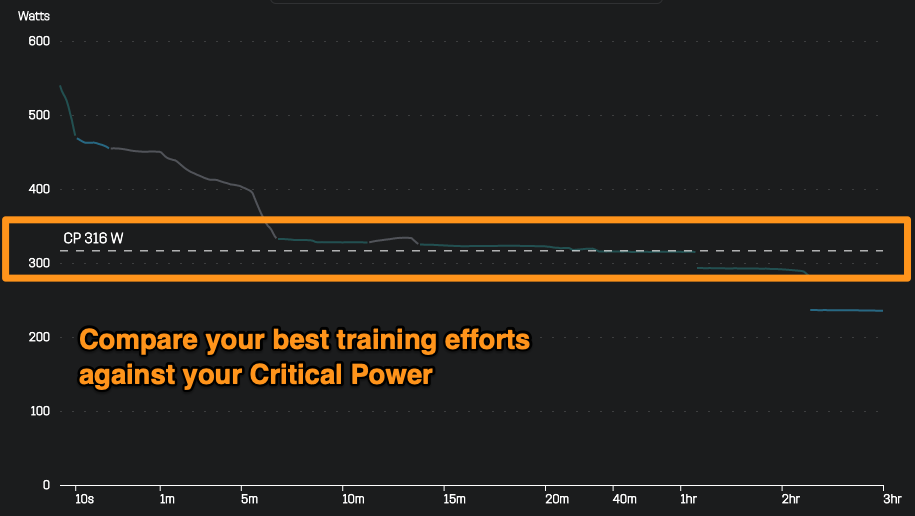
By comparing your Critical Power against your Power Duration Curve, you can identify training durations that you could log better efforts in.
For example, the data above indicates that the runner could log better efforts in the 5 minute to 20 minute range because their current best efforts are only slightly above their Critical Power.
View your maximum 10 second power in the Muscle Power view
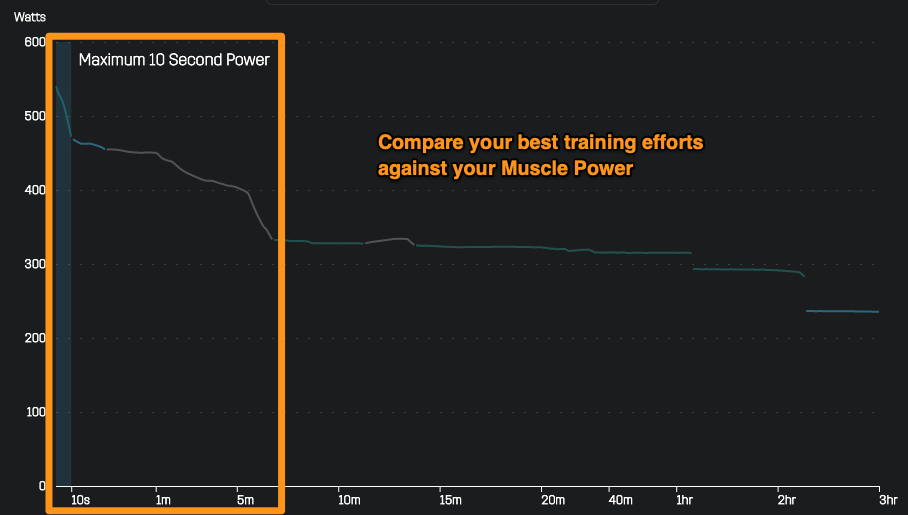
Your Muscle Power score is based on your peak 10-second continuous power. A high power output for short periods of time can contribute to improved performance across your entire Power Duration Curve.
See how long you can maintain your goal race effort with the Fatigue Resistance view
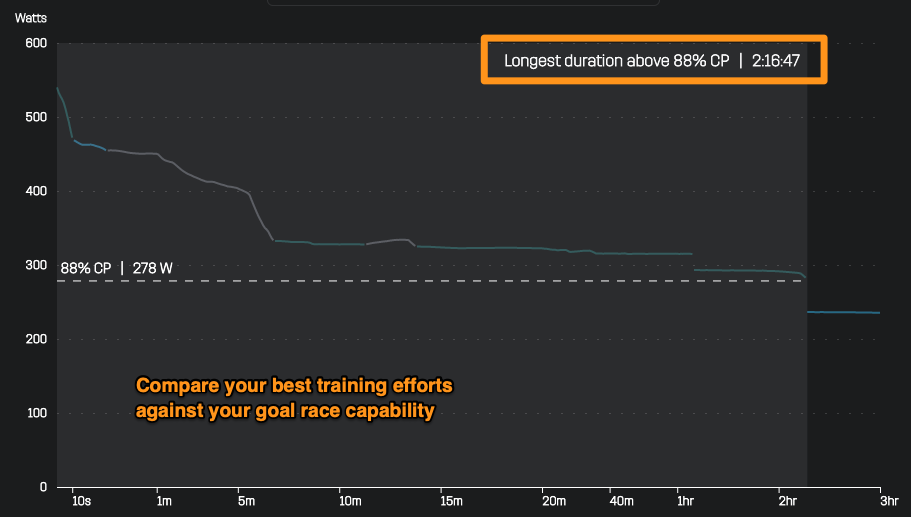
Your Fatigue Resistance score is based on the longest duration that you can hold just under your approximate target race power. Fatigue Resistance directly reflects your ability to hold a close-to-maximal effort for a longer period of time.
Monitor your longest run capability with the Endurance view
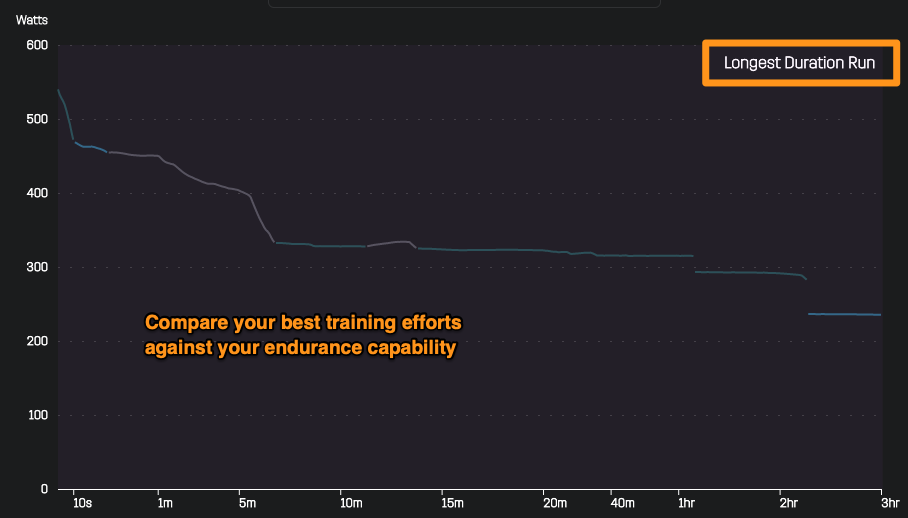
Your Endurance score is based on your longest continuous activity. Building up your endurance with longer runs helps improve your body's ability to sustain efforts for long durations.
How to access the new PowerCenter
The new PowerCenter is available now.
If you would like to access the new PowerCenter, please visit https://www.stryd.com/powercenter/ in your web browser.
If you are not signed in, you will be redirected to the sign in page first.
IMPORTANT: Before you visit the new PowerCenter and begin to enjoy this great update, please read this entire post.
This is our biggest update ever. You are not expected to master these features in a single day.
It is going to take some time to master these features.
We are going to be releasing a series of text guides and videos over the next month to help you get the most out of your data.
Today is just Day One.
You should load up the new PowerCenter, explore some features, and make sure it works.
However, you should not try to read all the knowledge base articles or try to understand every single detail today. You will overload yourself with info.
For example, you would never try to sit down and read an entire book in one sitting. You would digest and enjoy a chapter at a time.
Please apply the same strategy to the new PowerCenter. You should take on one feature at a time.
Here is what you should do to get started:
- Analyze one workout at a time
- Read just one article today, such as the explainer on the new Running Stress Balance chart
- Read just a few posts from other Stryders in the Stryd Community on Facebook
A short and important FAQ
Question:
A feature I used in the previous PowerCenter is missing! What happened to it? How can I get it back?
i.e. What happened to the Runner Profile Triangle? What happened to the Power Heat Map?
Answer:
Your familiar features are not gone! They have been replaced by improved versions.
Yes, all the useful functionality from the previous PowerCenter has been replaced and improved.
Some of this new functionality does not look like how it previously did. However, it is still available.
Runner Profile Triangle is now Training Distribution
The runner profile triangle is now the “Training Distribution” comparison inside of the Power Duration Curve module.
You can also find the workout recommendation engine by selecting either Fitness, Muscle Power, Fatigue Resistance, or Endurance inside of the “Training Distribution” comparison.
Training Load & Trends is now My Training
Training load features are now in the “My Training” module on the profile page.
The Metabolic Fitness chart from the previous generation PowerCenter is now the white "42 day average stress" line in the “My Training” module.
Power Heat Map is now Power Duration Curve
The power heat map is now the Power Duration Curve on the profile page.
We will send out a full email later this week with an explanation of all the features that have been replaced and improved!
Question:
How can I calculate my Critical Power? I cannot find the Critical Power calculator on the new PowerCenter!
Answer:
The manual Critical Power calculator has now been moved to the mobile app. The calculator inside of the mobile app is the same as the calculator in the previous generation PowerCenter. You can find this by opening up the app, going into the Settings tab, and selecting ‘Critical Power.’
If you have more questions, please click here to read the knowledge base.
What should you do if you enjoy the new PowerCenter?
You commonly see our customer success team through our Facebook group or support channel.
But, you rarely see the entire design and development team that has been working behind the scenes on these updates for many months now.
They have been studying customer surveys and doing tireless design iterations to get this new PowerCenter right.
We have spent the last 5 years learning from the Stryd Community.
We have used all of that data and experience to create this new platform.
It is our gift to you and we think you are going to love it.
And, if you do love the new PowerCenter, here is what we want you to do:
1. Tell your friends about new insights that the new PowerCenter has helped you discover.
2. Ask thoughtful questions and help out by answering questions you see in the Stryd Community.
3. Run more, diversify your training, and feed the right data into PowerCenter so the insights improve and can be helpful to you.
4. And, most importantly, learn and enjoy. These are entirely new tools to the running world and you are on the forefront of the running power revolution.
Please head to https://www.stryd.com/powercenter/ to dive into the new PowerCenter!
Best,
The Stryd Team