
Running Stress Score


After each day’s workout, we all wonder — how was my workout today? Have I done enough? Did I push too hard? Indeed, consistent training with the correct load and variety spurs the best physiological improvement; the secret sauce to how top runners build fitness quickly, to run faster.
This is why we designed Running Stress Score (RSS), a single number to help runners understand their day-by-day training. It quantifies how much you’ve trained and the variety of intensity in your training.
The primary input to RSS is running power, the direct measure of running intensity, along with the time spent at different training intensity levels, as follows.
RSS = 100 x training duration x (Power/CP)^K
● Critical Power (CP) represents the highest power that a runner can maintain in a quasi-steady state without fatiguing, where the duration may range from 30-70 minutes, depending on the individual.
RSS quantifies your day-by-day running intensity relative to your critical power. This makes RSS comparable, enabling self-comparison throughout a training season, training load comparison between different workout types, as well as comparison between athletes with different abilities.
The coefficient K accounts for the fact that different intensity levels spur different physiological adaptations. In order to achieve your best potential, it is important to have the right training variety across all intensity levels, while allowing the proper recovery time for each.
Note that, RSS shares a similar form as the Training Stress Score (TSS) used in cycling. Yet, cycling and running are fundamentally different sports. In particular, run training is often constrained by mechanical stress. Increasing running intensity results in higher stress on our body than comparable increases in cycling. Indeed, the coefficient K for running RSS is significantly higher than that of cycling TSS, reflecting the higher stressing effect of intensive run workouts.
Simply put, RSS is a point system, awarding a certain number of points to each of your workouts, based on how intensely and how long you train. RSS is designed around a reference benchmark score, such that if you run for exactly one hour at your critical power, you will earn 100 RSS points. The following two tables show the RSS score for one-minute of running at different intensity zones (levels), as well as the typical RSS found in a set of common workouts and races.
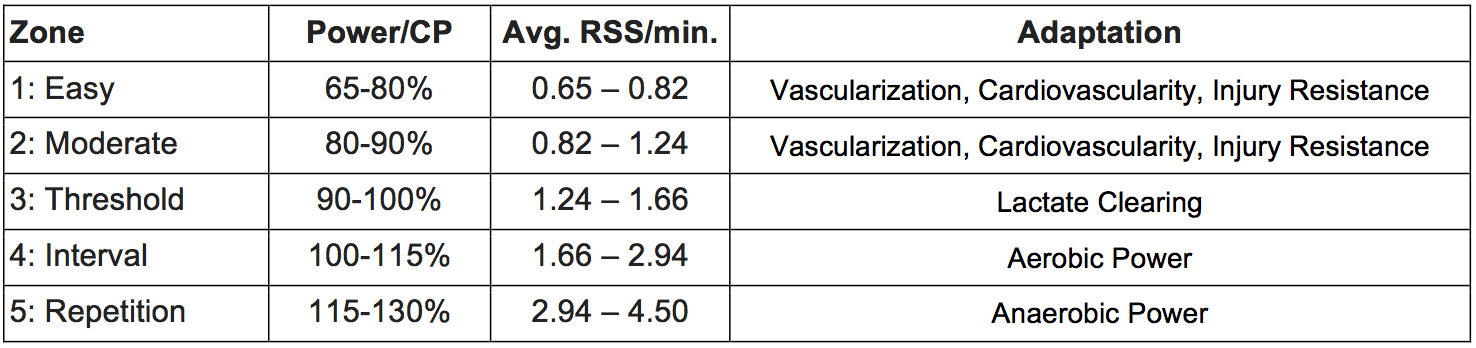
Table 1. RSS per minute at different intensity zones (levels).
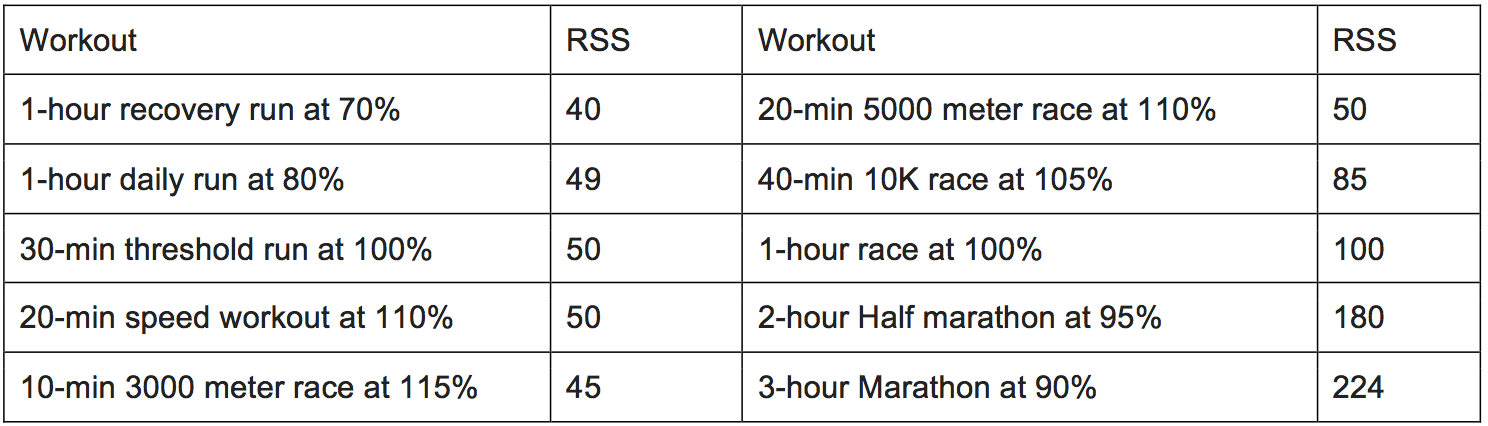
Table 2. Typical RSS of exemplary workouts and races (provided by Hans van Dijk and Ron van Megen).
Using RSS to better understand your training plan###
Our day-by-day run workout is structured in the form of a multi-week/month training plan. RSS can help you establish a quantitative view of the training plan, understand the underlying training philosophies and strategies, as well as the specific objectives of different training phases. Such knowledge will help you improve training specificity, gain better training results, and thereby do better on race day. Next, we will provide a few examples to elaborate on the details.
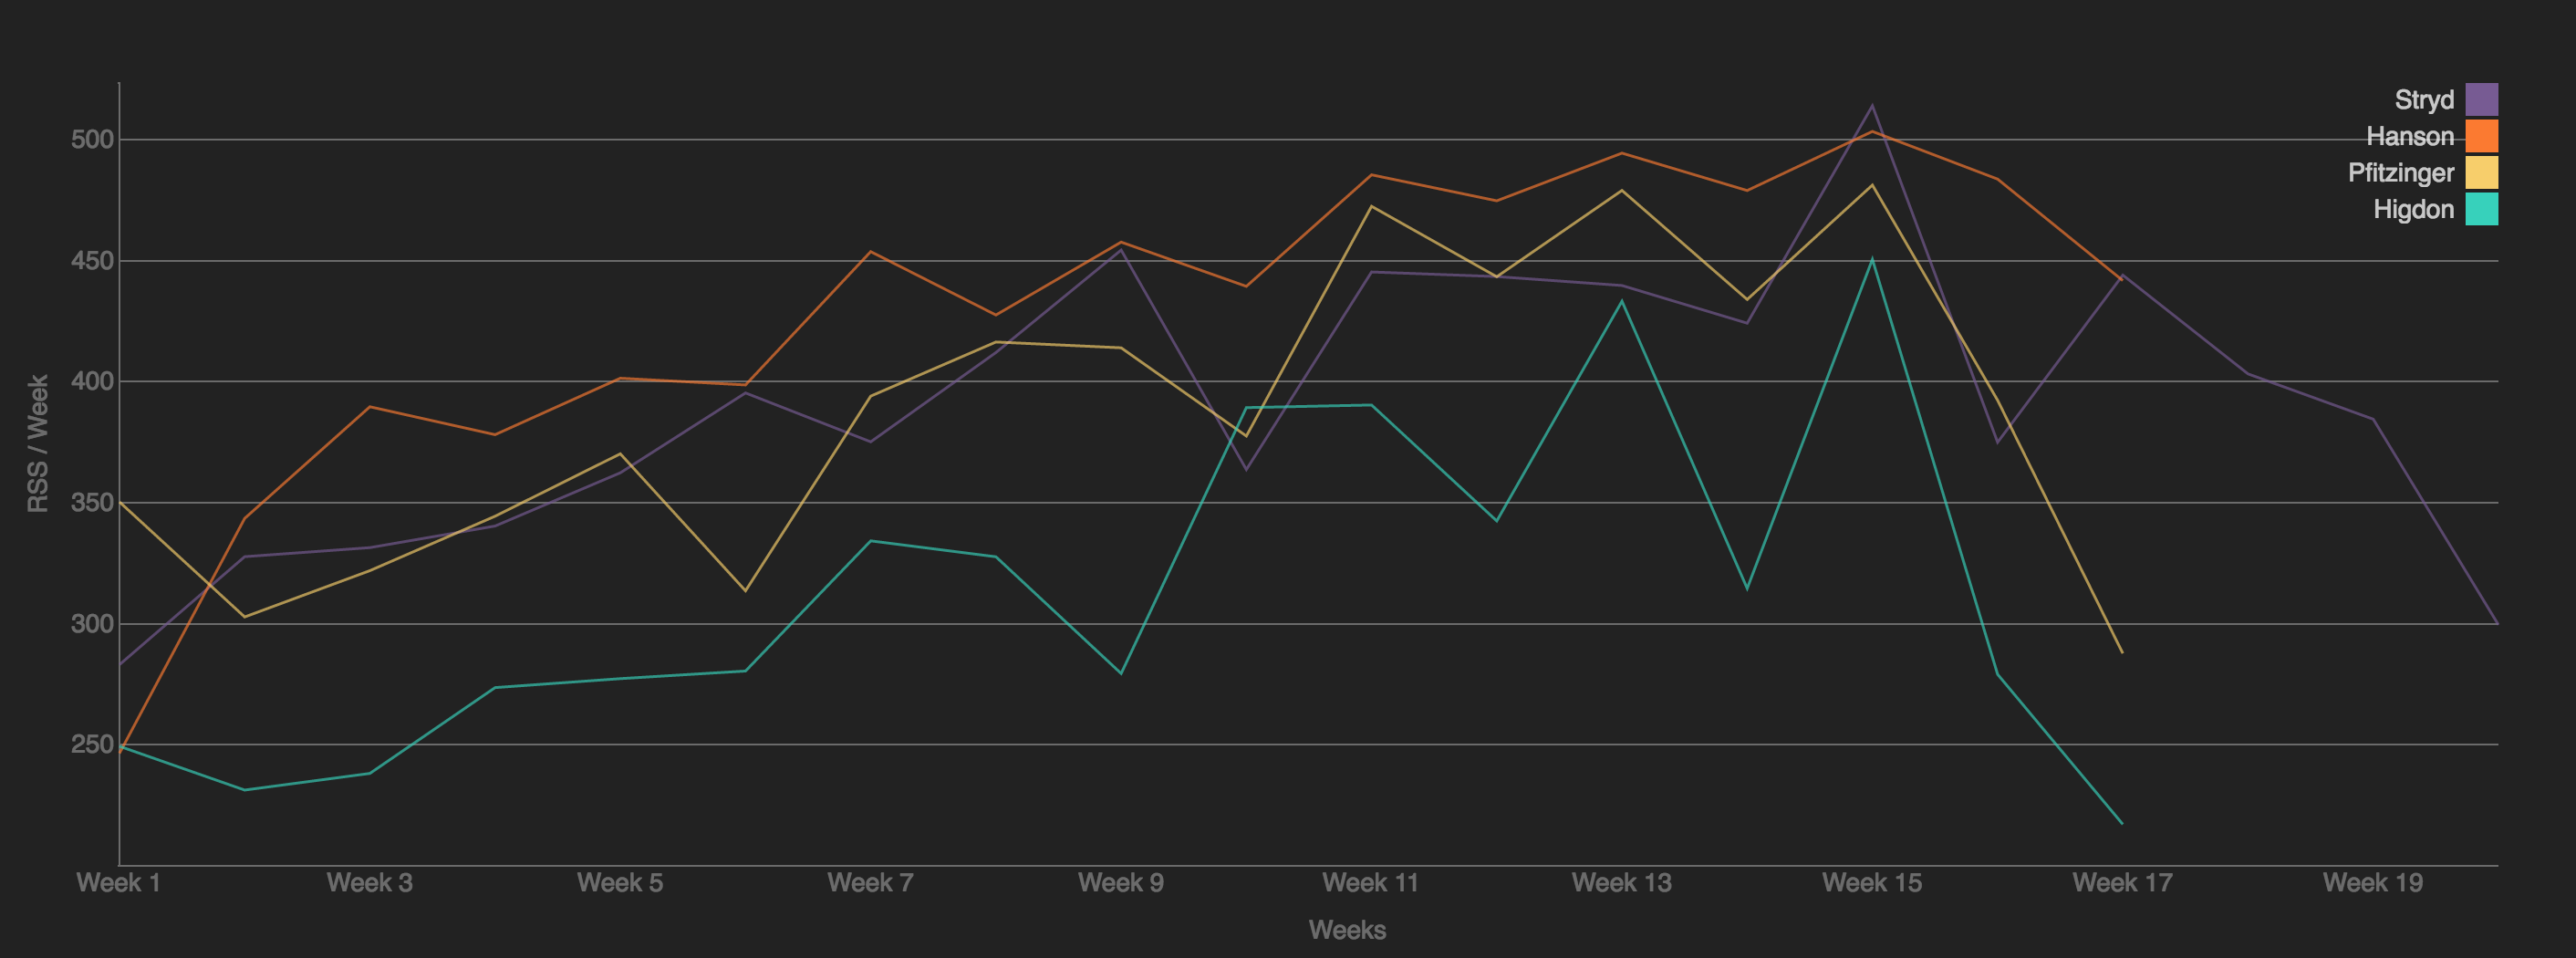
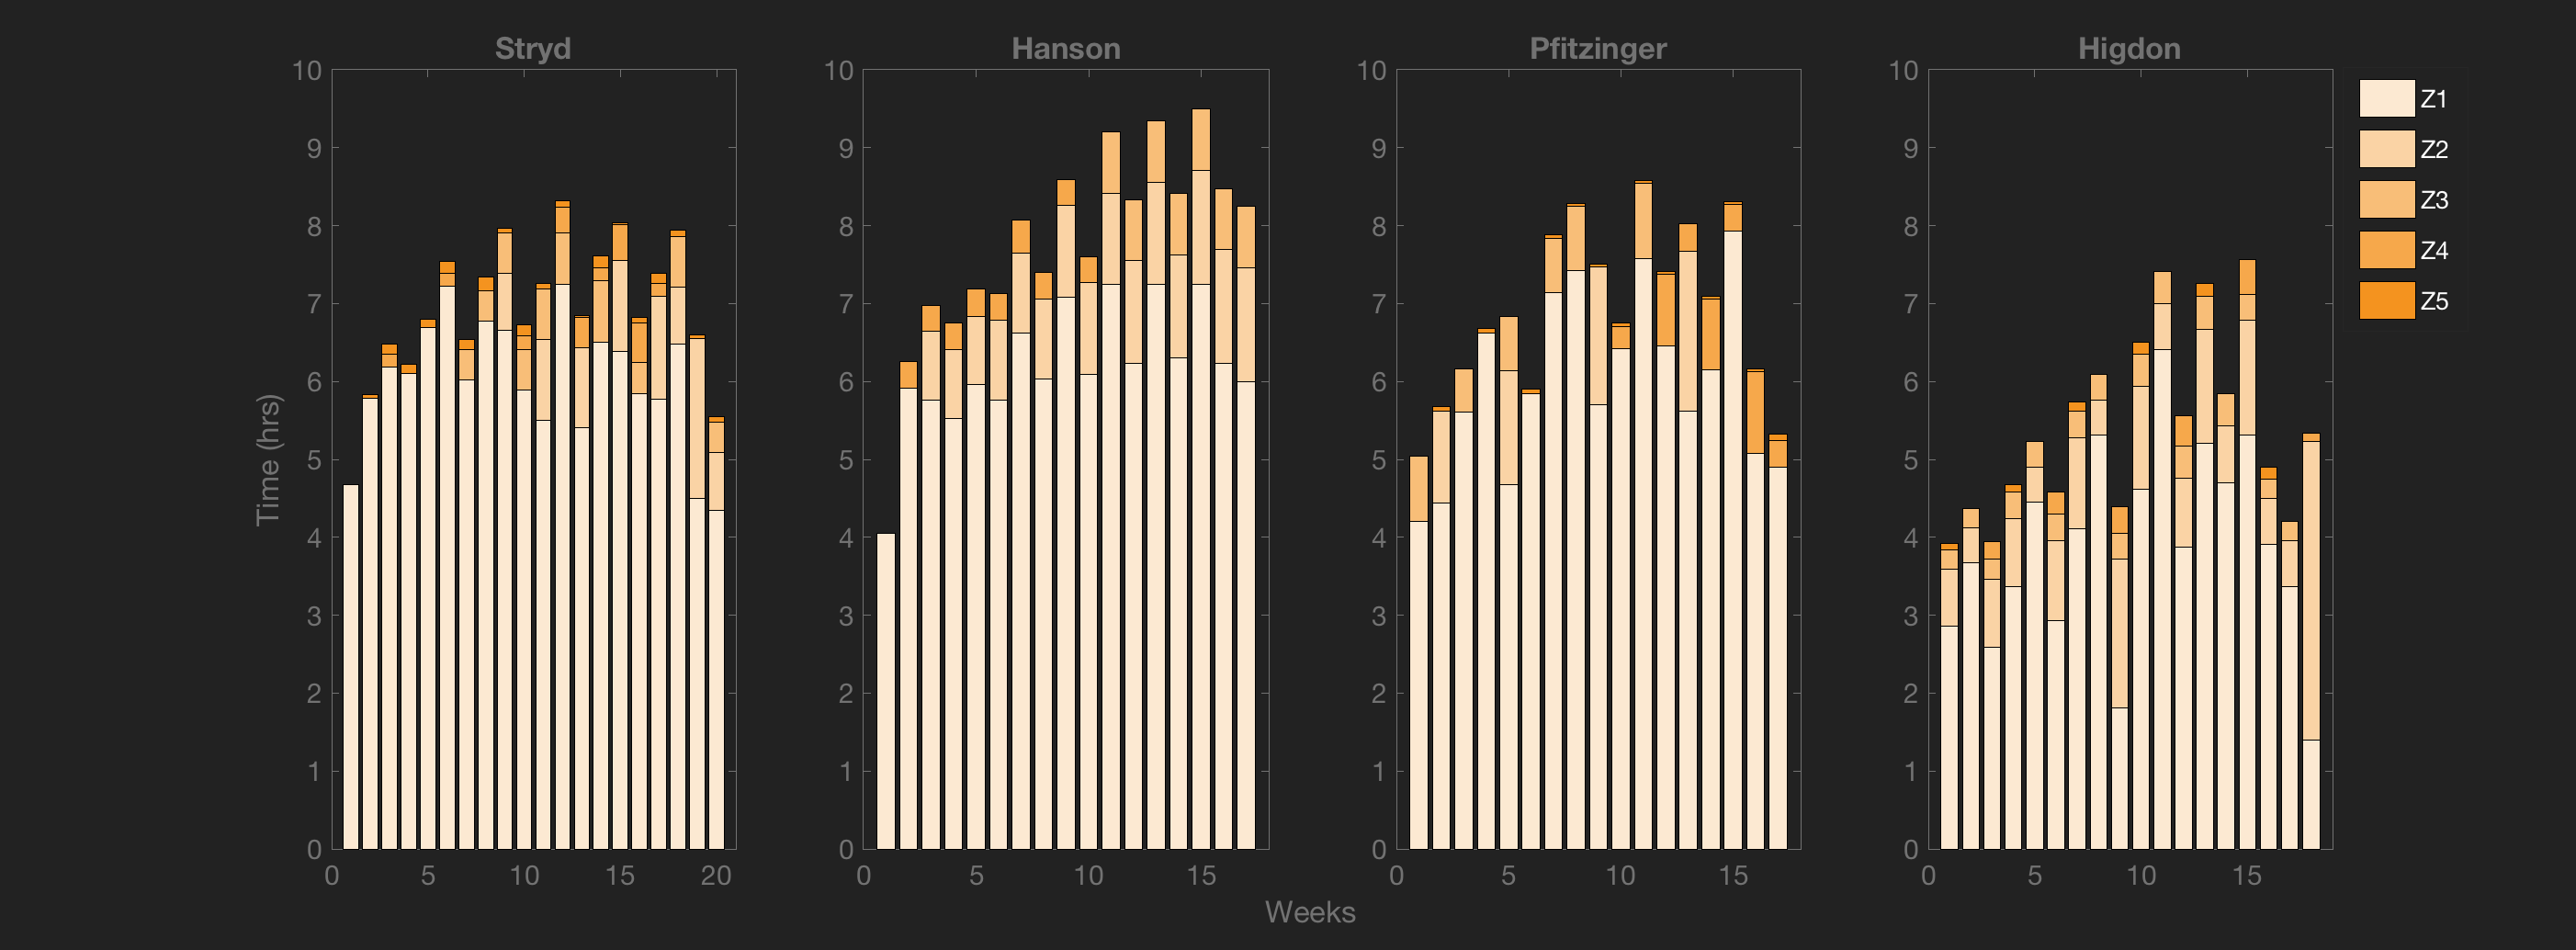
How does workload progress throughout a training season? The following plot shows the weekly RSS of four widely used Marathon training plans developed by four world-known coaches. It is interesting to see that, even though the four training plans were developed by coaches with different training philosophies, they exhibit similar workload progression throughout a training season. Specifically, for all four plans, workload ramps up over the base phase with an approximate 5-10% week-by-week increase. Workload peaks about two-thirds into the training season, and the volumes all decrease sharply during the tapering phase. In addition, the training intensity zone breakdowns all follow similar patterns across all four training plans. For instance, high-intensity run training is rare during the base phase across all four training plans. Clearly, there is common consensus in terms of the basic training principles.
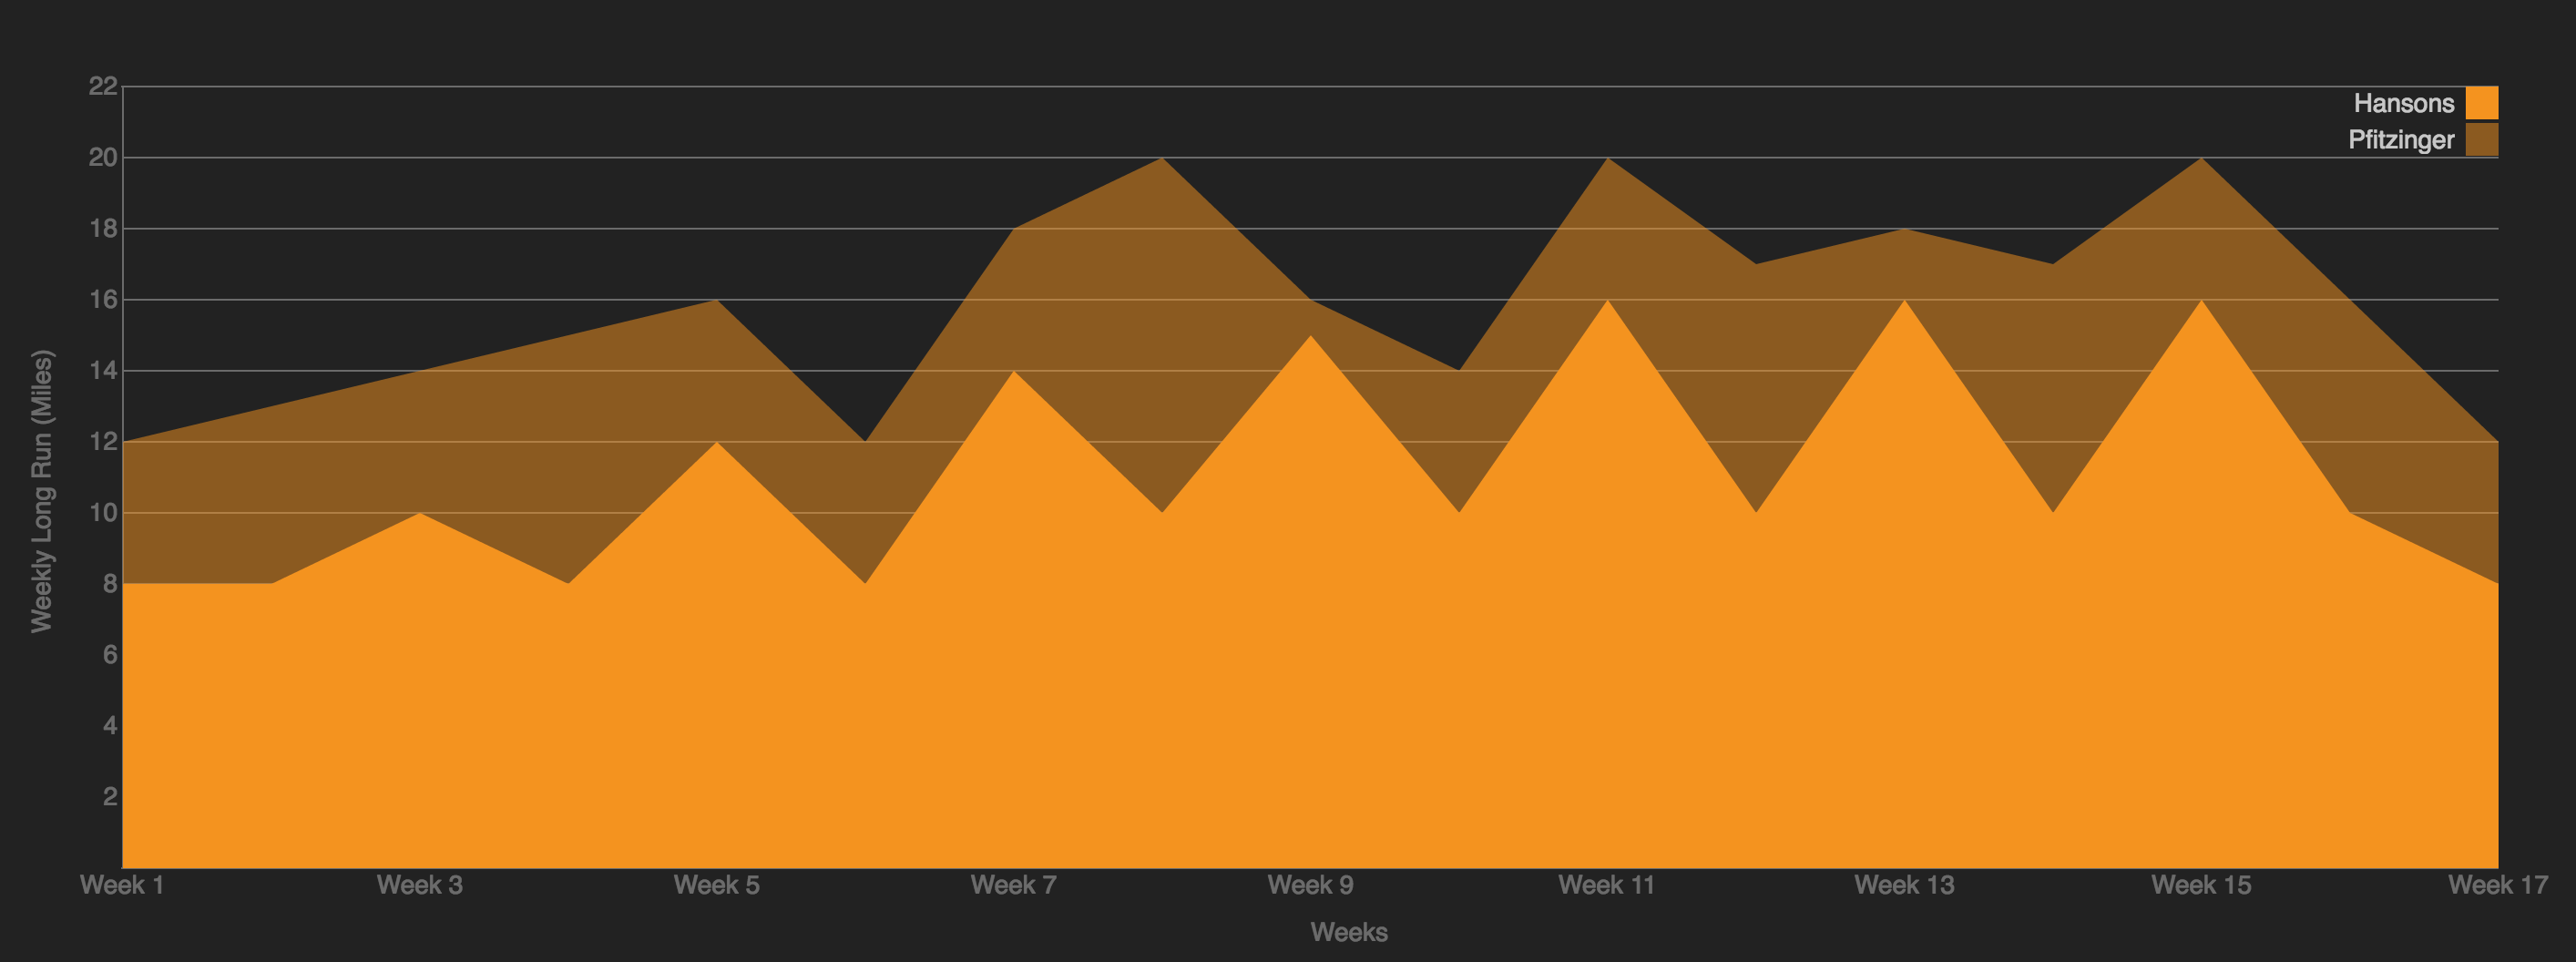
How do different training philosophies influence training practices? The following plot compares two of the Marathon plans developed by two world-known coaches. Hansons’ plan consists of a sequence of micro-training cycles, e.g., a three-week intensive training with one-week recovery. On the other hand, the weekly long runs in Pfitzinger’s plan are significantly longer than that of Hanson’s plan, with less volume reduction during the tapering phase. These observations show how RSS can be used to concisely describe each particular training philosophy.
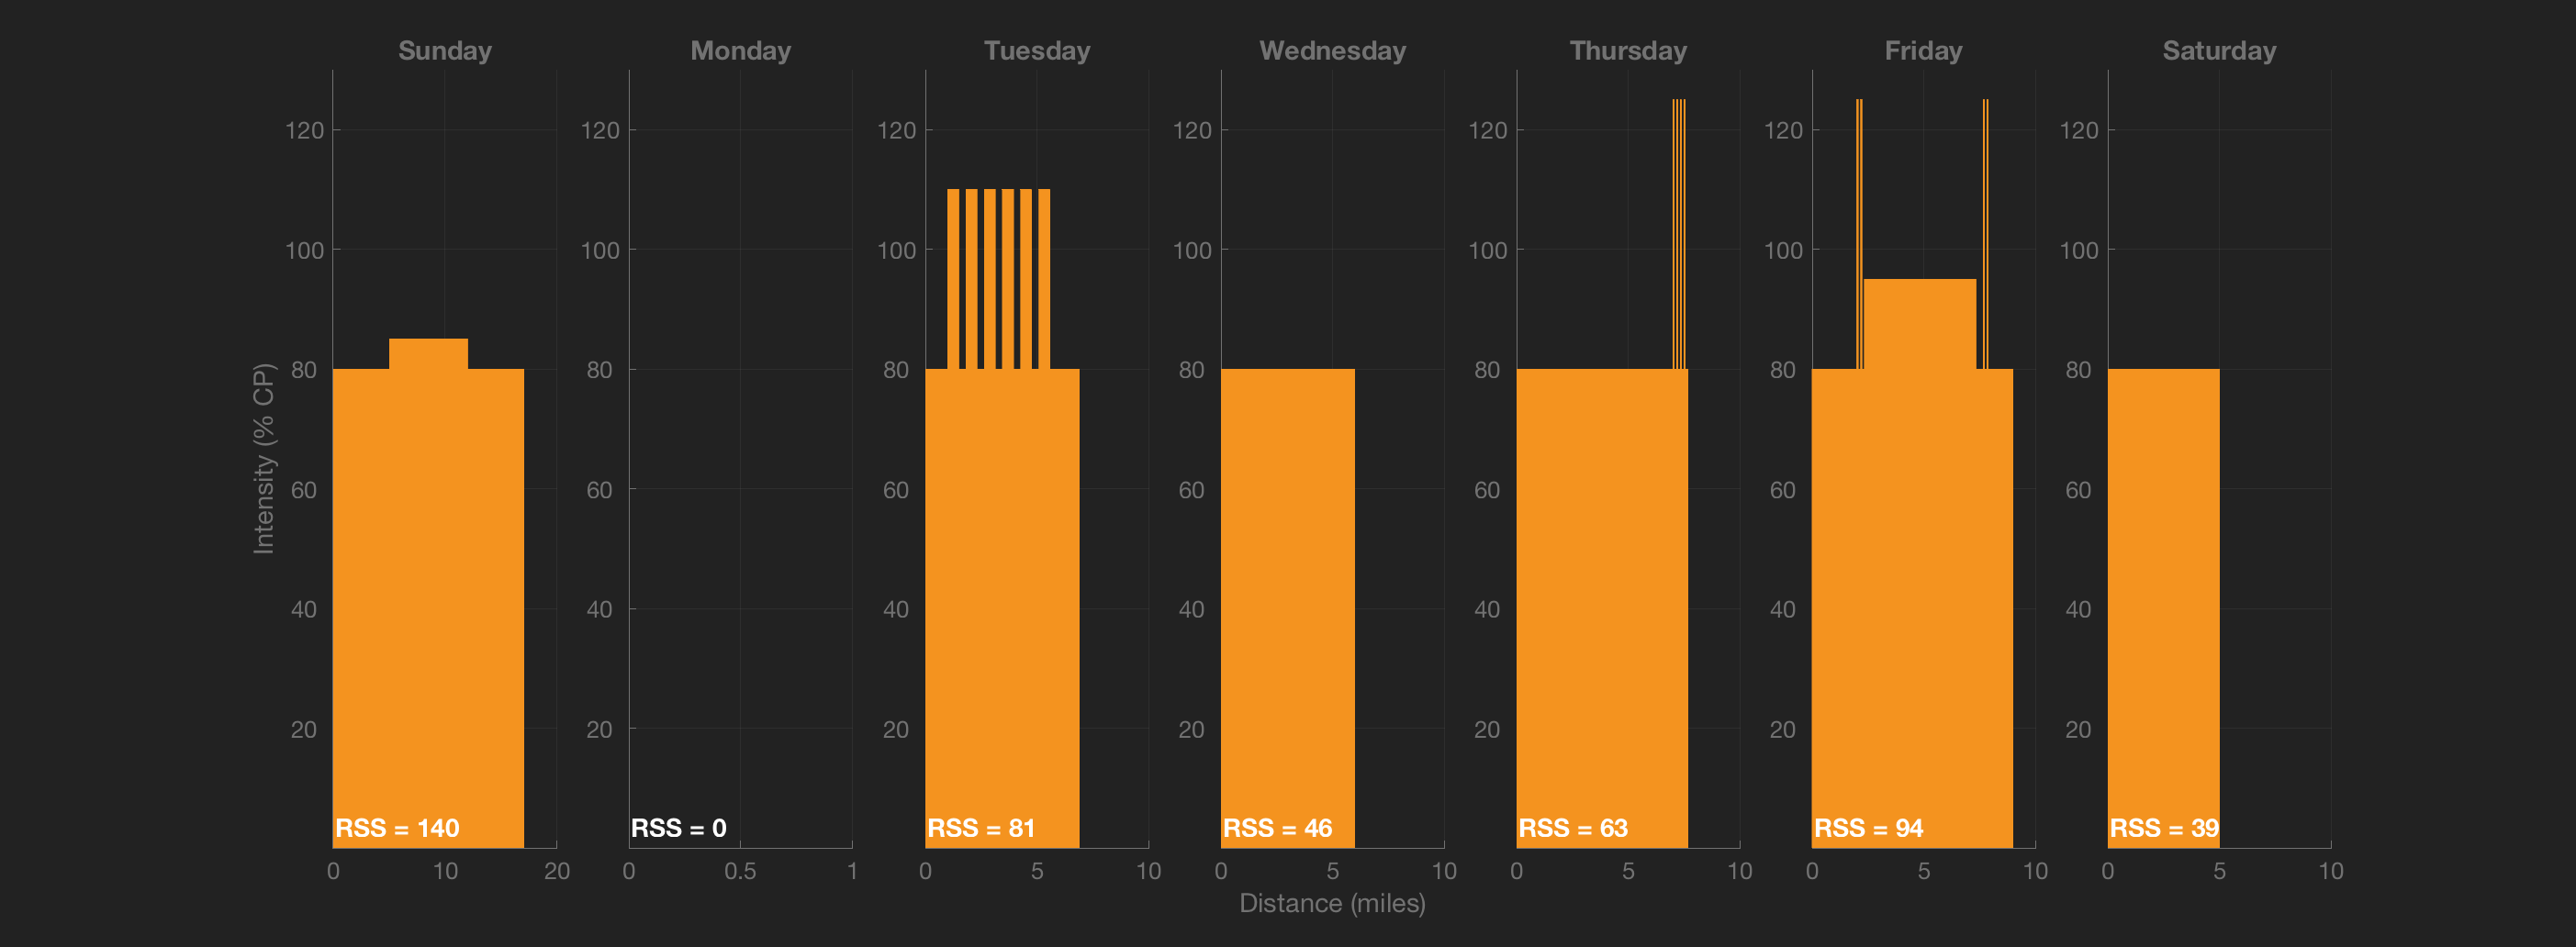
How to plan a weekly workout? All four training plans also follow similar weekly workout compositions during the quality training phase, e.g., intervals and hill repeats, recovery runs, and weekend long runs. The following plot shows an exemplary weekly workout, which consists of three high-quality workouts, spread across the week, and separated by recovery runs and a resting day. All high-quality workouts show similar training workload, i.e., RSS score, but with distinct intensity composition. Again, how much you train (overall workload) and how you train (variety) are the key factors to effective training.
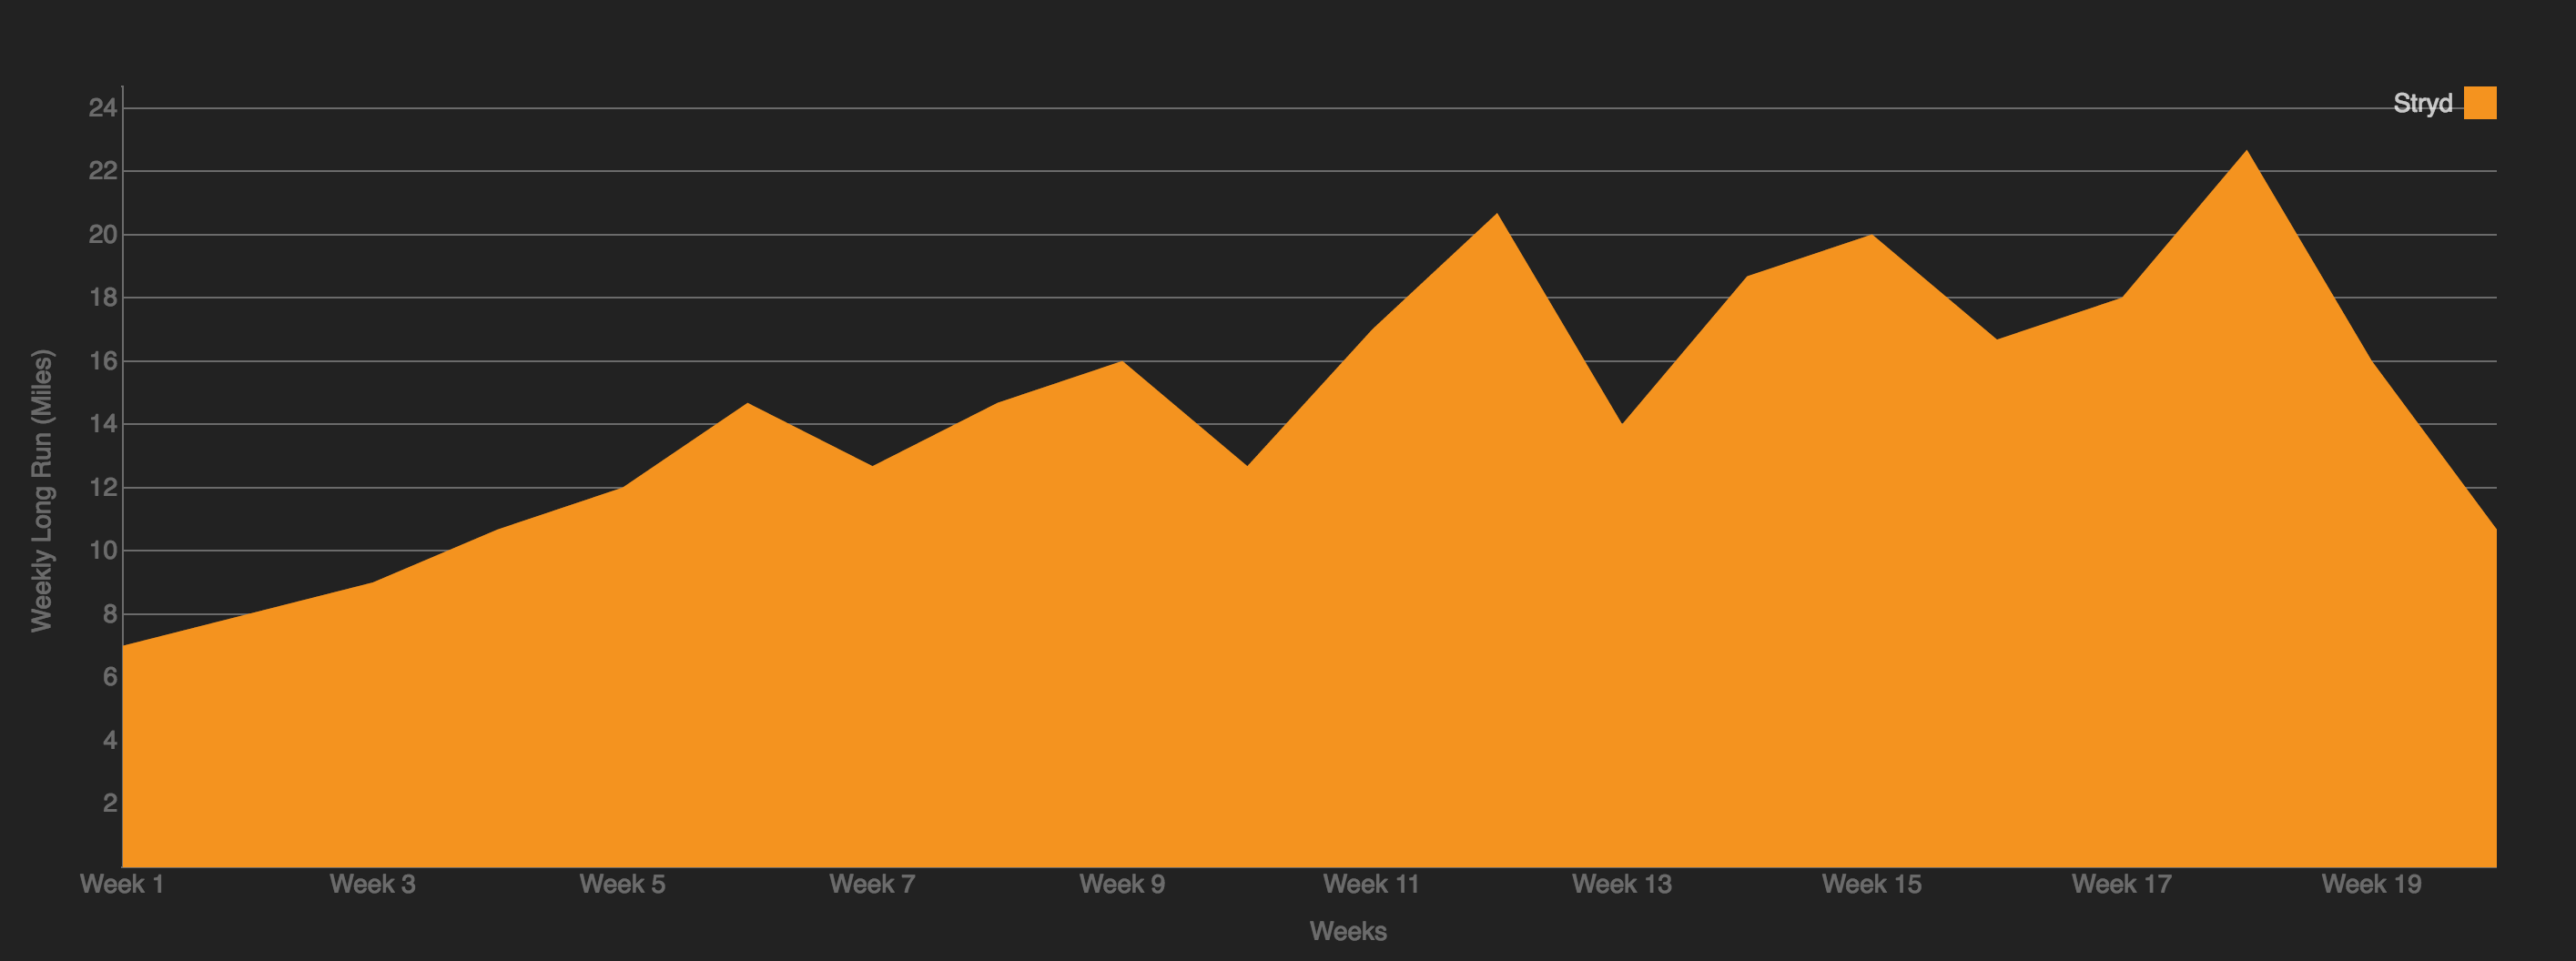
How does a specific type of workout progress throughout a training season? The following figure shows how the weekend long run progresses throughout a training season. During the base phase of the training season, gradually ramping up long run helps build up enough mileage to prepare your body ready for the quality training phase. During the quality training phase, long runs are essential to educate your body to burn fat, and improve your leg strength and resistance to fatigue. During the tapering phase, race-pace training helps improve your running economy while at race pace, and reducing long run mileage helps accelerate recovery, so you will feel refreshed on race day.
Analyzing your daily workout on Stryd PowerCenter###
Stryd PowerCenter uses RSS to help you obtain quantitative understanding of your run training, from your day-by-day workout to seasonal training.
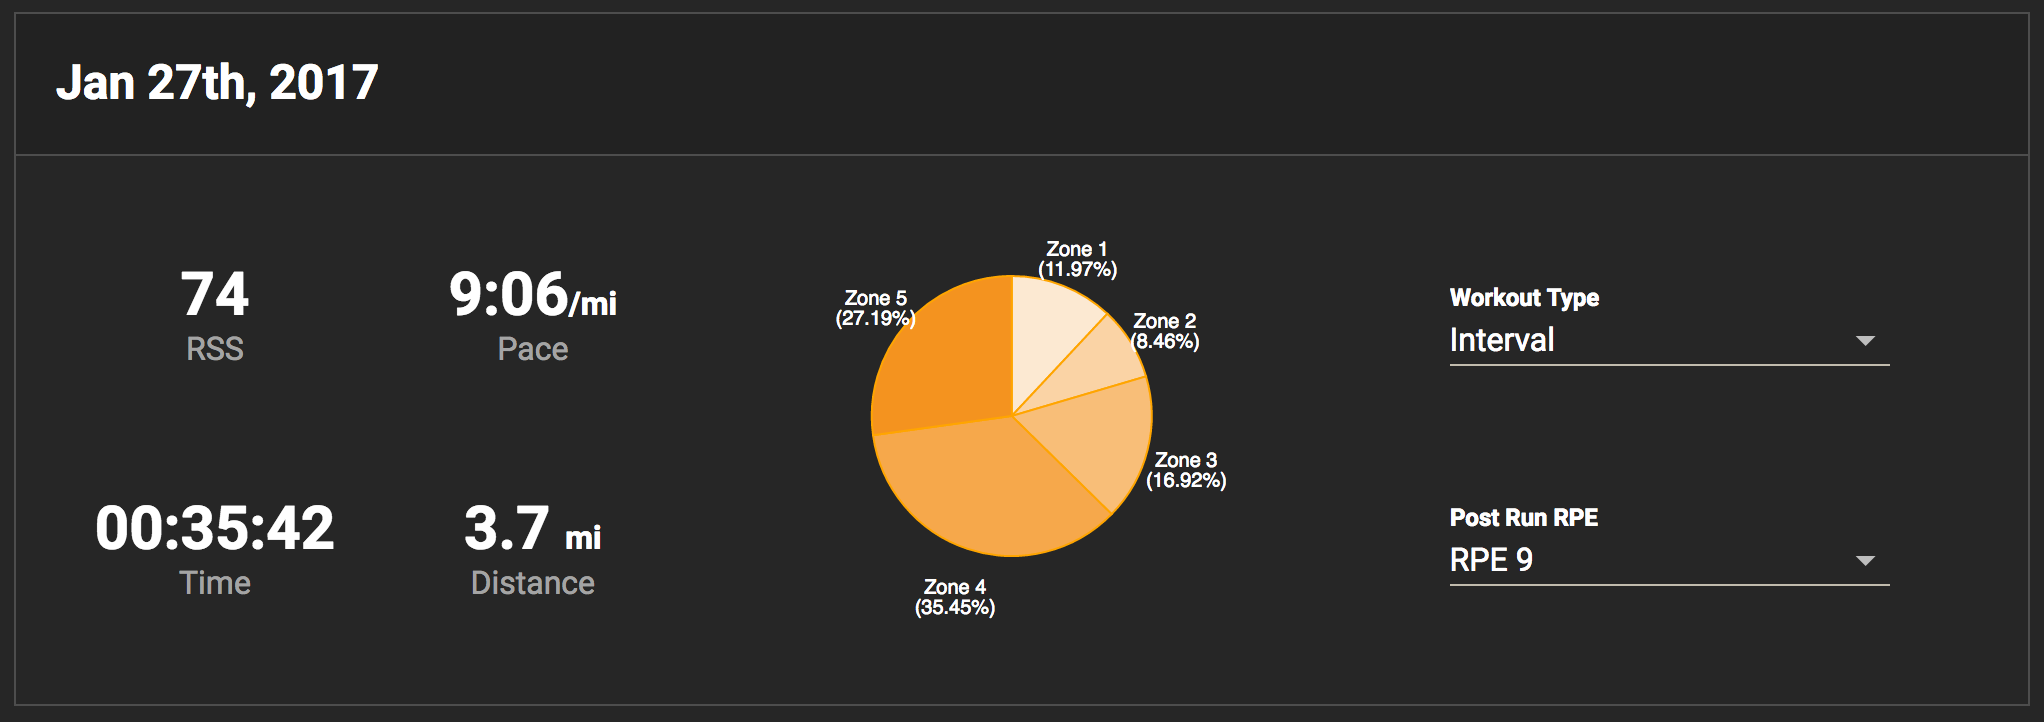
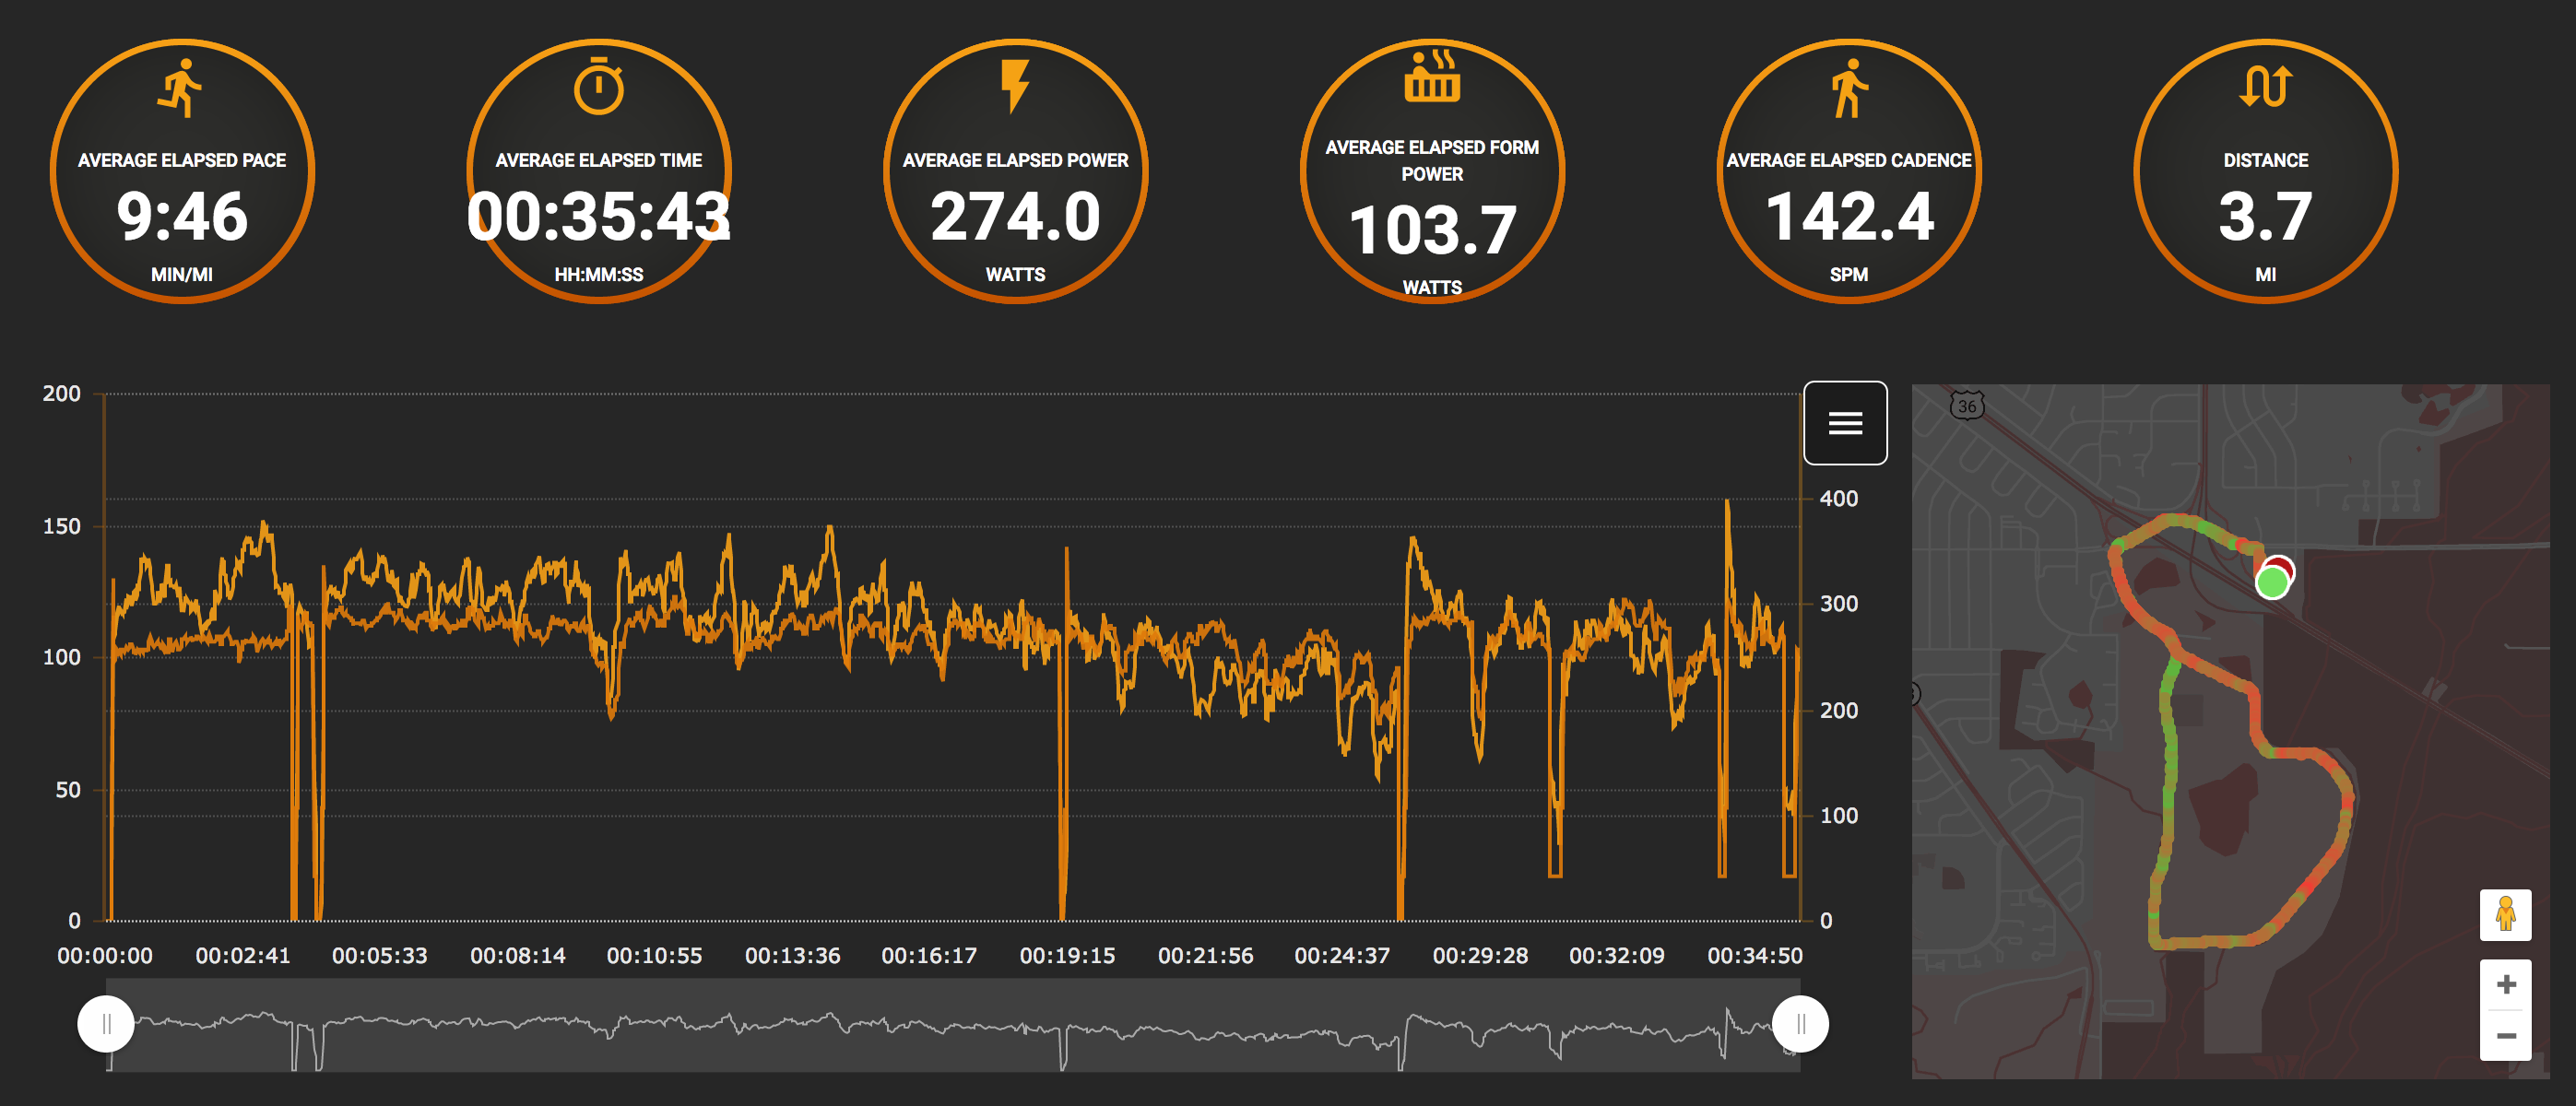
After each day’s workout, when you log onto Stryd PowerCenter, you will see the overall RSS score from your daily workout (top left), the training intensity zone breakdown (pie chart), along with other key workout metrics, such as pace and duration. You can compare it with your training plan to see if you’ve achieved your daily goal in terms of compliance to the workout and its intensity levels. RSS is supported by the training plans released by Stryd, including distances from 5K to Marathon.
The PowerCenter provides detailed workout analysis, showing how your RSS progresses within your daily workout. For instance, considering an interval workout, using the lap breakdown feature you can clearly quantify how your training stress accumulated session by session.
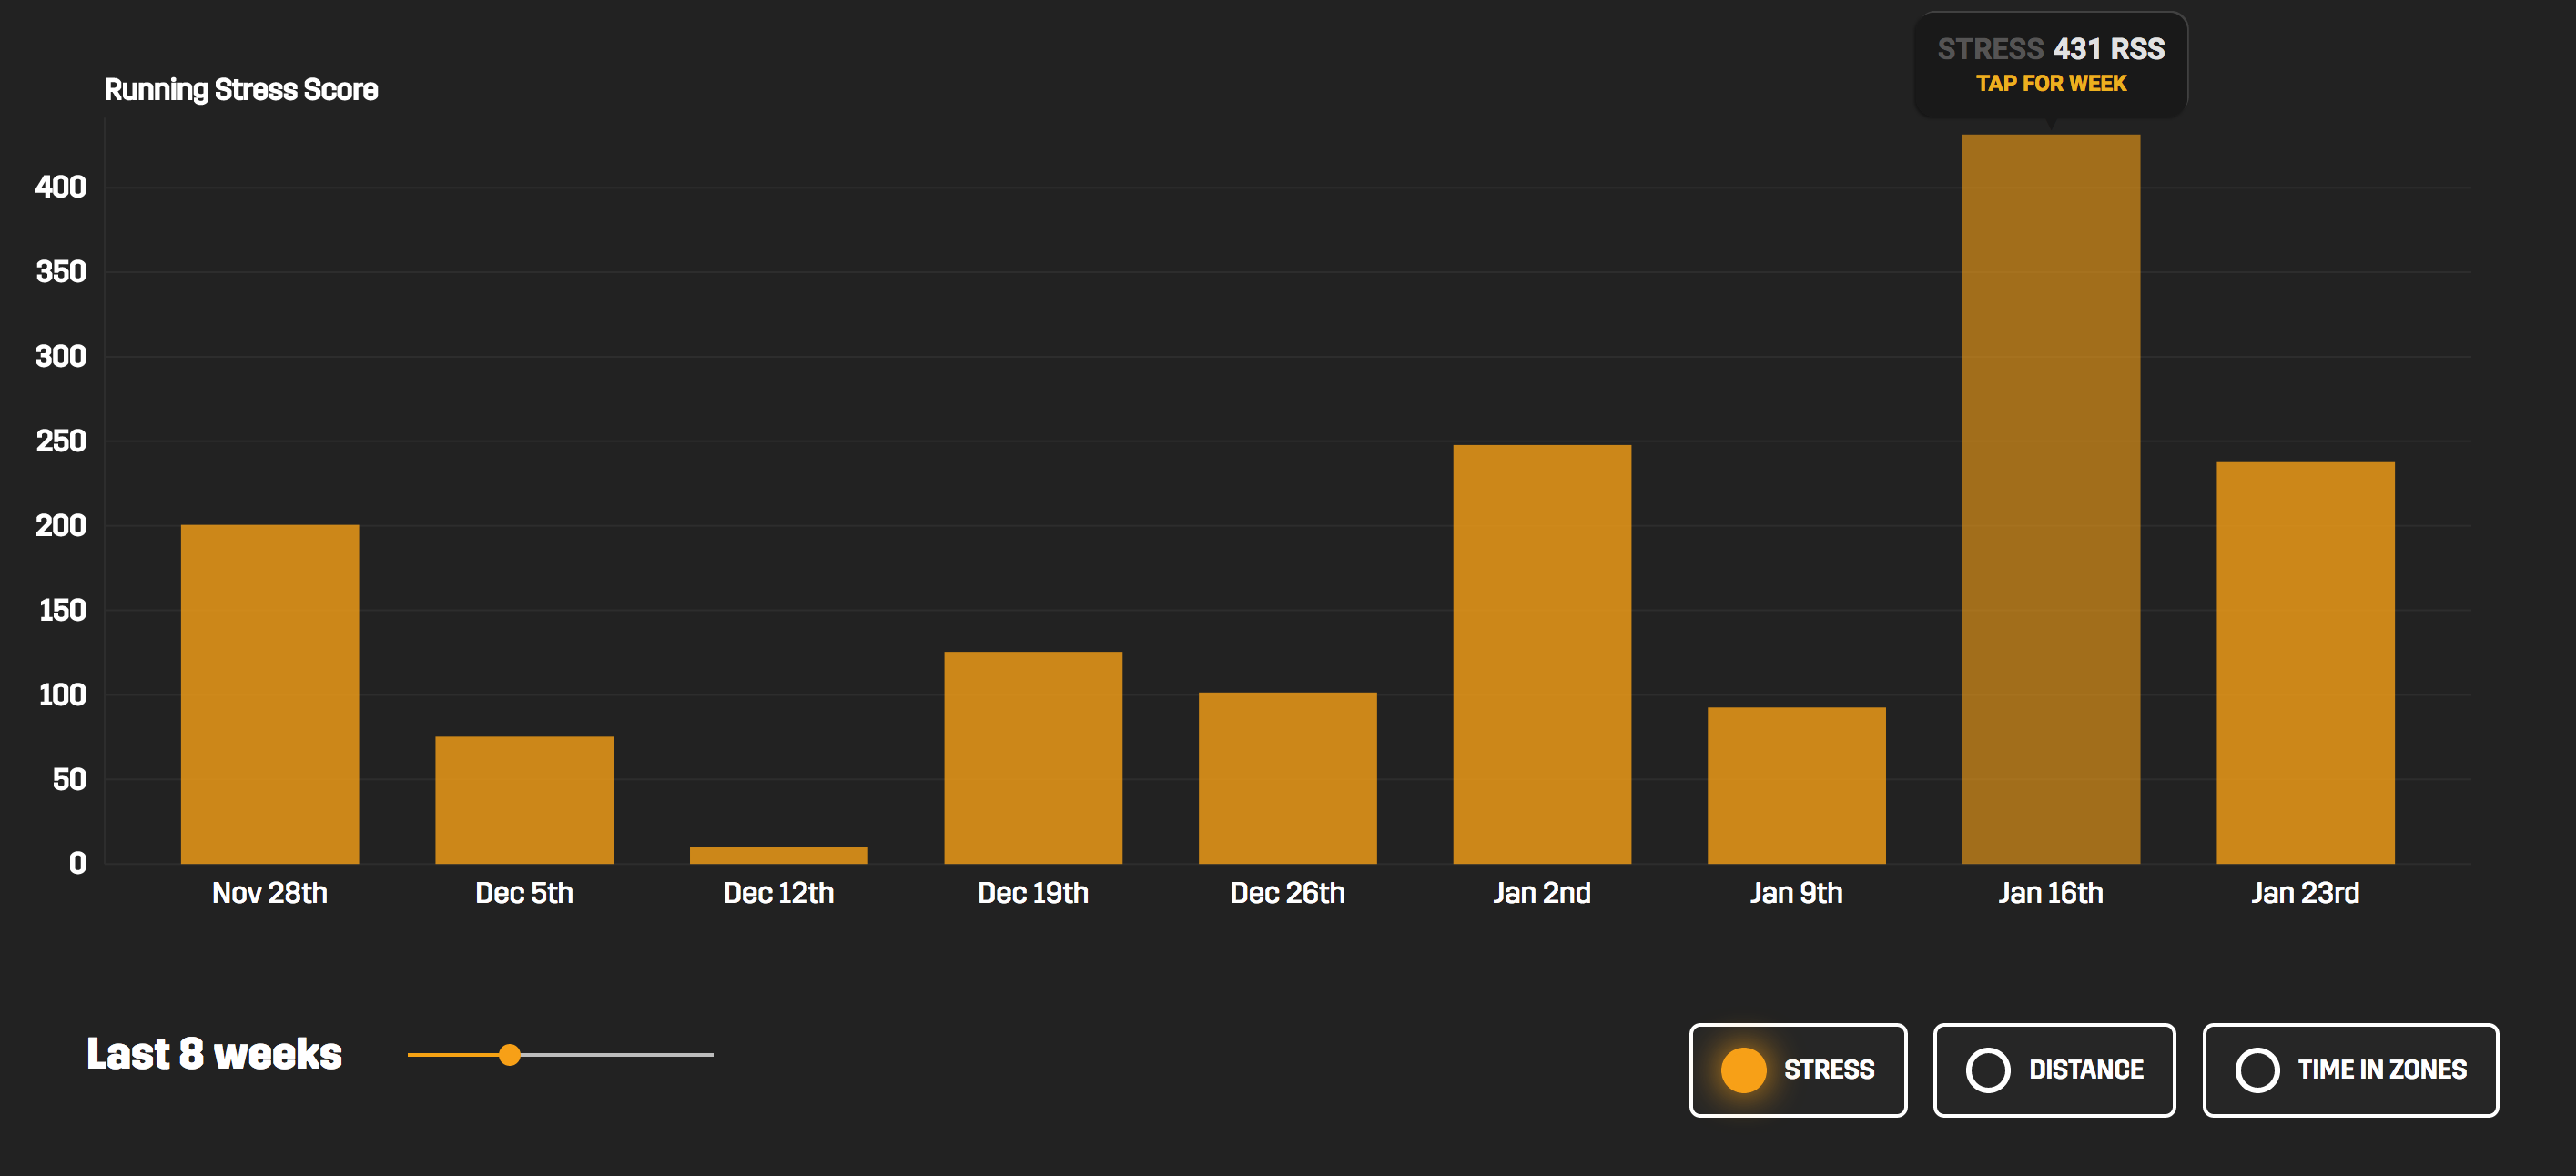
The PowerCenter further provides a chart showing your daily, weekly and monthly RSS summaries, helping you understand how your training progresses throughout the training season.
In summary, it is our hope that RSS can shine light on and into your workouts, enabling you to customize your training workload and training variety, and therefore helping you train effectively, and ultimately, run faster.