
What is the maximum impact of air resistance?


There is a worldwide hunt in the search for options to optimize running performance through reducing the air-resistance among runners, coaches and running scientists.
Cyclists and speed-skaters have been doing this for a long time already by developing optimal aerodynamic conditions (clothing, frames, body position, streamlining, drafting).
In running, there have been a few breakthroughs in capturing air resistance recently. The first came with the development of the new Stryd, which reports the Air Power in real time. The second was the sensational INEOS 1:59 Challenge. In Vienna, Eliud Kipchoge was helped by 41 pacers (5 teams of 7 pacers and 6 reserves) to achieve his magnificent 1:59:40.
The pacers ran in a surprising V-formation. The captain of the team ran in front of Eliud, while 4 more pacers ran sideways to the left and right in front of him. Sideways left and right behind Eliud ran pacers 6 and 7. We consider the reduction of the air-resistance resulting from this V-formation a key factor in the success. The idea of the V-formation came from Robby Ketchell. Together with TU Eindhoven (the Netherlands) professor Bert Blocken the concept was developed with the intent of providing maximum drafting for Eliud. And it worked!

We will discuss the concept of air-resistance in more detail in this paper.
What do we know exactly about the fundamentals of air-resistance?
How important is air resistance?
And to what extent can it be optimized?
Theory
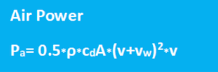
In our book ‘The Secret of Running’, we have discussed the theory of the air-resistance in various chapters. According to the fundamental laws of physics, the power required to surmount the air resistance Pa (Air Power) is determined by the density of the air ρ (in kg/m3) the air-resistance factor cdA (in m2), the running speed v (in m/s) and the wind speed vw (in m/s), as shown in the box.
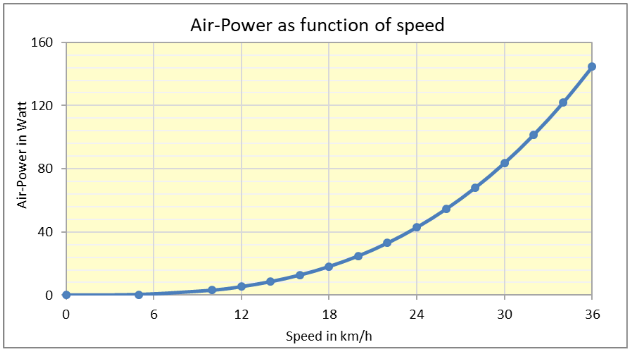
The figure below shows the Air Power as a function of running speed v at the standard conditions ( temperature 20°C, air-pressure 1013 mbar, so ρ = 1.205 kg/m3, cdA = 0.24 m2, no wind, so vw= 0 m/s). At Eliud’s speed (21.1 km/h) we can read that the Air Power at the standard conditions equals 29 watts or 8.5% of Eliud’s estimated total running power of 341 watts (6.09 watts/kg).
Does the standard value of 0.24 m2 accurately reflect the air resistance factor cdA?
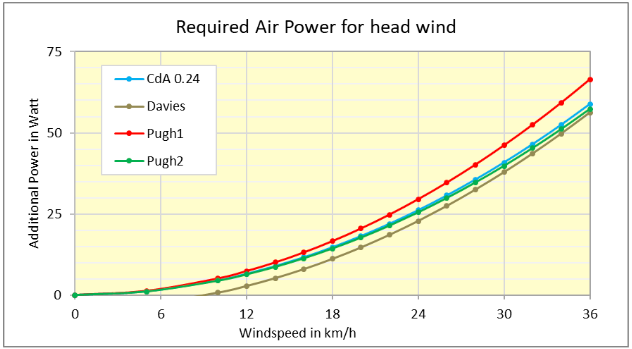
3 wind tunnel investigations [^1] have been reported in literature, in which the impact of the wind speed on the oxygen consumption of several test runners was determined experimentally.
We have used the data of the increased oxygen consumption (at head wind conditions) from these 3 papers to calculate the additional equivalent Air Power that the runners experienced, based on the theory of our book ‘The Secret of Running’. The results are shown in the graph below. The light blue line shows the results according to the above equation with a cdA value of 0.24 m2. Based on this we conclude that the standard value of 0.24 m2 accurately reflects the air resistance in practice.
Why is the cdA-value of 0.24 m2 so low?
Our friend and co-author of our book ‘The Secret of Cycling’, Guido Vroemen, wondered whether the 0.24 m2 was too low? He compared it to aerodynamically optimized time-trial cyclists which have a cdA of around 0.21 m2. In cycling, the cdA-value is around 0.40 m2 while standing on the pedals and even 0.60 m2 while sitting. The values include the bike.
The explanation of the difference can be found in the muscle efficiency. Running against a head wind means that the leg muscles must deliver positive work. From literature it is known that the muscle efficiency for positive work is significantly higher than for cyclic work, like in cycling. This is comparable to running uphill, where the muscle efficiency is also known to be higher than at a level course, as found by Minetti et al. [^2] This is described in the chapters in our book that deal with the impact of hills.
Obviously, a higher muscle efficiency leads to a lower oxygen consumption and thus to a lower Air Power. In our book, we have defined a hill factor η of around 57% to correct for this. Pugh and Davies found the same results in their wind tunnel experiments, so a higher muscle efficiency at headwinds and a lower muscle efficiency at tailwinds. Davies even showed that the muscle efficiency uphill and with a headwind was exactly the same, provided the total resistance was also the same.
Consequently, we have used a wind factor η similarly to the hill factor. At the same resistance the numerical value of the wind factor is the same as the hill factor. The result is that the wind factor η is also around 57% in case of a head wind (it actually depends somewhat on the wind speed). With a tailwind the wind factor is much lower (around 28%, also depending somewhat on the wind speed), in analogy to the hill factor which is significantly lower downhill as a result of braking forces.
The wind factor thus explains the difference in cdA between running and cycling. It could be argued that the running cdA of 0.24 m2 reflect a real cdA of 0.42 m2 multiplied by the wind factor of 57%.
The standard value of 0.24 m2 in combination with the equation of the box accurately reflect the Air Power that runners experience with a headwind, as measured by Pugh and Davies in their wind tunnel experiments.
Is the cdA-value of 0.24 m2 the same for all runners?
Certainly not, this depends on the body posture!
The impact of this can be calculated with well know DuBois formulae for Body Surface Area:
BSA = 0.007184 * W0.425 * H0.725
W is the body weight in kg and H the body length in m.
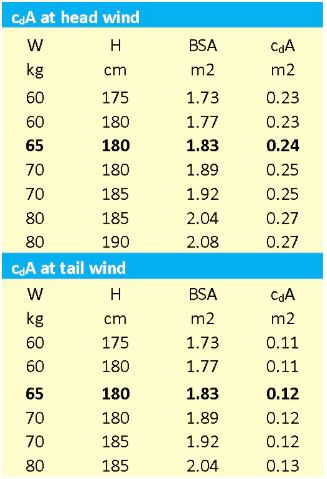
Consequently, tall and heavy runners have a higher cdA-value than smaller and lighter weight runners. The cdA-value can be calculated from the BSA by multiplication of 25.9% (the part of the BSA facing the wind), 0.87 (the cdA-value) and the wind factor η (57% at a headwind and 28% at a tailwind).
We have made these calculations in the table below. In bold the average value for the test persons of Pugh and Davies are shown. Consequently, smaller, lightweight runners will have a cdA of 0.23 m2 in a headwind and 0.11 m2 in a tailwind.
To what extent can the cdA be reduced by drafting by pacers and running in a pack?
Pugh measured experimentally that the air-resistance could be reduced by as much as 80% by running very close (10 cm) behind another somebody else. Prof. Blocken reported that in cycling in the bulk of a closely packed peloton the resistance may even be reduced by 90%. In running, such high percentages are not realistic because it is not possible to run so closely together in a pack. We have given examples in our book that it is possible in practice to reduce the cdA value to 0.20 m2 (so a reduction of 20%) by using pacers or running in a pack.
Finally, we have made a calculation of the cdA-value achieved by the V-formation at INEOS 1:59. We have done this by first calculating the total running power (Pr) of Eliud Kipchoge during his world record of 2:01:39 in Berlin, by assuming that the cdA was 0.20 m2 was (he used ‘normal’ pacers for part of the race. With our computer model we calculated that Eliud’s running power was the 341 Watts (6.09 watts/kg) that we mentioned before.
Next, we calculated how low his cdA in Vienna must have been in order to obtain the 1:59:40, assuming that his running power was also 341 watts.
The result of the model calculation was a cdA of 0.16 m2, so 25% lower than with regular pacers and 50% lower than with no pacers. In practice this will probably the lower limit of the cdA in running, without using artificial appliances like wind shields and a pace vehicle (which Dutchman Fred Rompelberg used to establish the world cycling speed record at 268 km/h!). In the wake of such specially designed cars, the cdA becomes almost 0. In such circumstances (so without any air-resistance) Eliud could in theory run a time of 1:54 with his running power of 341 watts!
If you would like to purchase The Secret of Running (or the German version, Das Geheimnis des Laufens), you can do so at the bottom of store.stryd.com.
[^1] Pugh, Oxygen intake in track and treadmill running with observations on the effect of the air resistance, J. Physiol. (1970), 207, pp 823-835);

Pugh, The influence of wind resistance in running and walking and the mechanical efficiency of work against horizontal or vertical forces, J. Physiol. (1971), 213, pp 255-276;

Davies, Effects of wind assistance and resistance on the forward motion of a runner, J. Appl. Physiol. (1980), pp 702-709.

[^2] Minetti et al, Energy cost of walking and running at extreme uphill and downhill slopes, J. Appl. Physiol. (2002), 93, pp 1039-1046