Efficiency & the tale of three races

In our book (www.thesecretofrunning.com) we have discussed the Energy Cost of Running (ECOR) in several separate chapters.
First, we have shown that on a level and hard course, the ECOR is typically 0.98 kJ/kg/km. Of course, this number will not be the same for everyone: it depends on your body posture and your running style. Generally, it is believed that the ECOR of highly efficient elite runners could be as low as 0.90 kJ/kg/km, whereas the ECOR of inefficient joggers could be as high as 1.10 kJ/kg/km. So far, we have seen that our own data and those of many other runners are quite close to 1.00 kJ/kg/km.
Obviously, a lower ECOR means that you are running more efficiently and consequently you can run faster with the same power. So every runner should try to lower his ECOR! Unfortunately, we cannot change our body posture (apart from shedding excess body fat). But we can try to optimize our running style!
Comparison of ECOR of 3 runners during Dutch Championships Half Marathon
The authors Hans van Dijk and Ron van Megen participated in the Dutch Championships Half Marathon, along with their friend Willem de Weerdt. In this post we will analyze the results, based on their Stryd power data. The conditions of the race were quite tough: many bridges and dikes had to be crossed (total altitude difference 98 m) and the runners faced a strong wind (Beaufort wind force 5). The table below gives the results.

Please note that we have calculated the ECOR as follows:
ECOR (in kJ/kg/km) = Unit Power (in Watt/kg) divided by the speed (in m/s)
The table already gives an interesting result: apparently the ECOR-values of the 3 runners differed by some 4%. This means that Hans used 4% less energy for his running as compared to Willem! This is a remarkable difference. The big question is to what extent these differences can be related to the running style of the 3 runners?
Comparison of ECOR of the 3 runners during the race
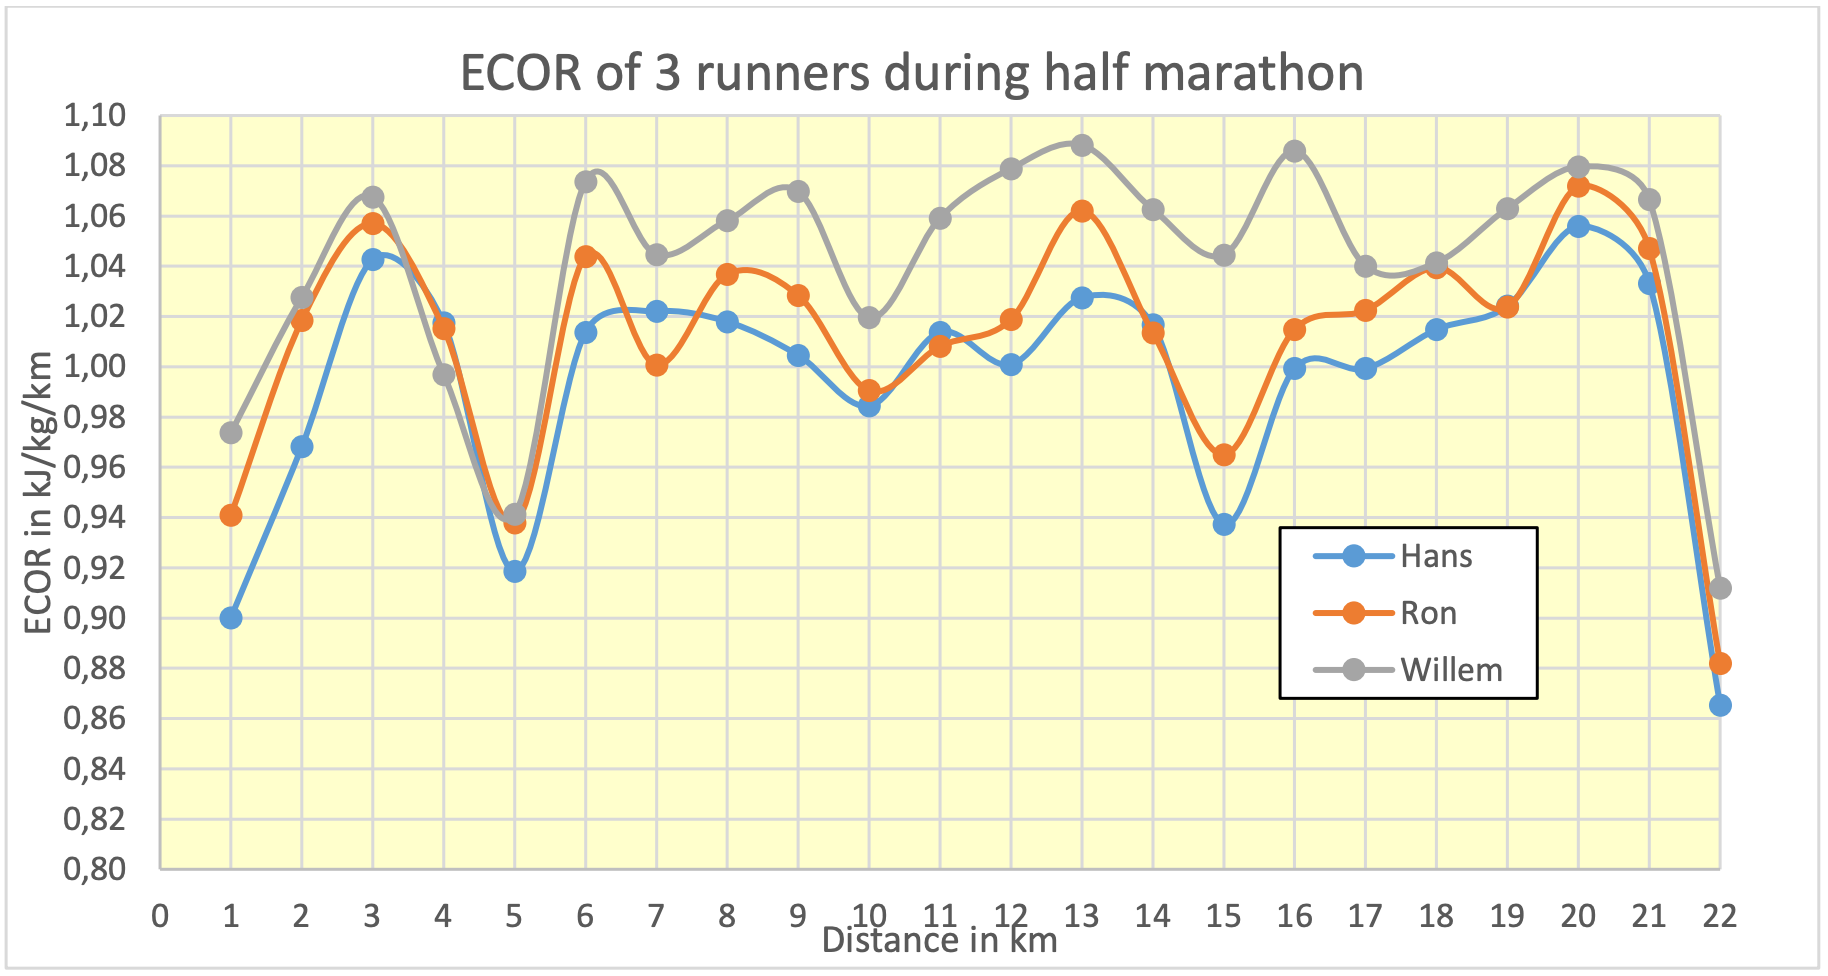
We made a more detailed analysis by calculating the ECOR of the 3 runners for every km of the race. The results are presented in the figure below and show- despite the remarkable pattern- that the difference between the 3 runners was quite consistent throughout the race: Willem always had the highest ECOR and Hans always had the lowest ECOR.

Impact of altitude differences on ECOR
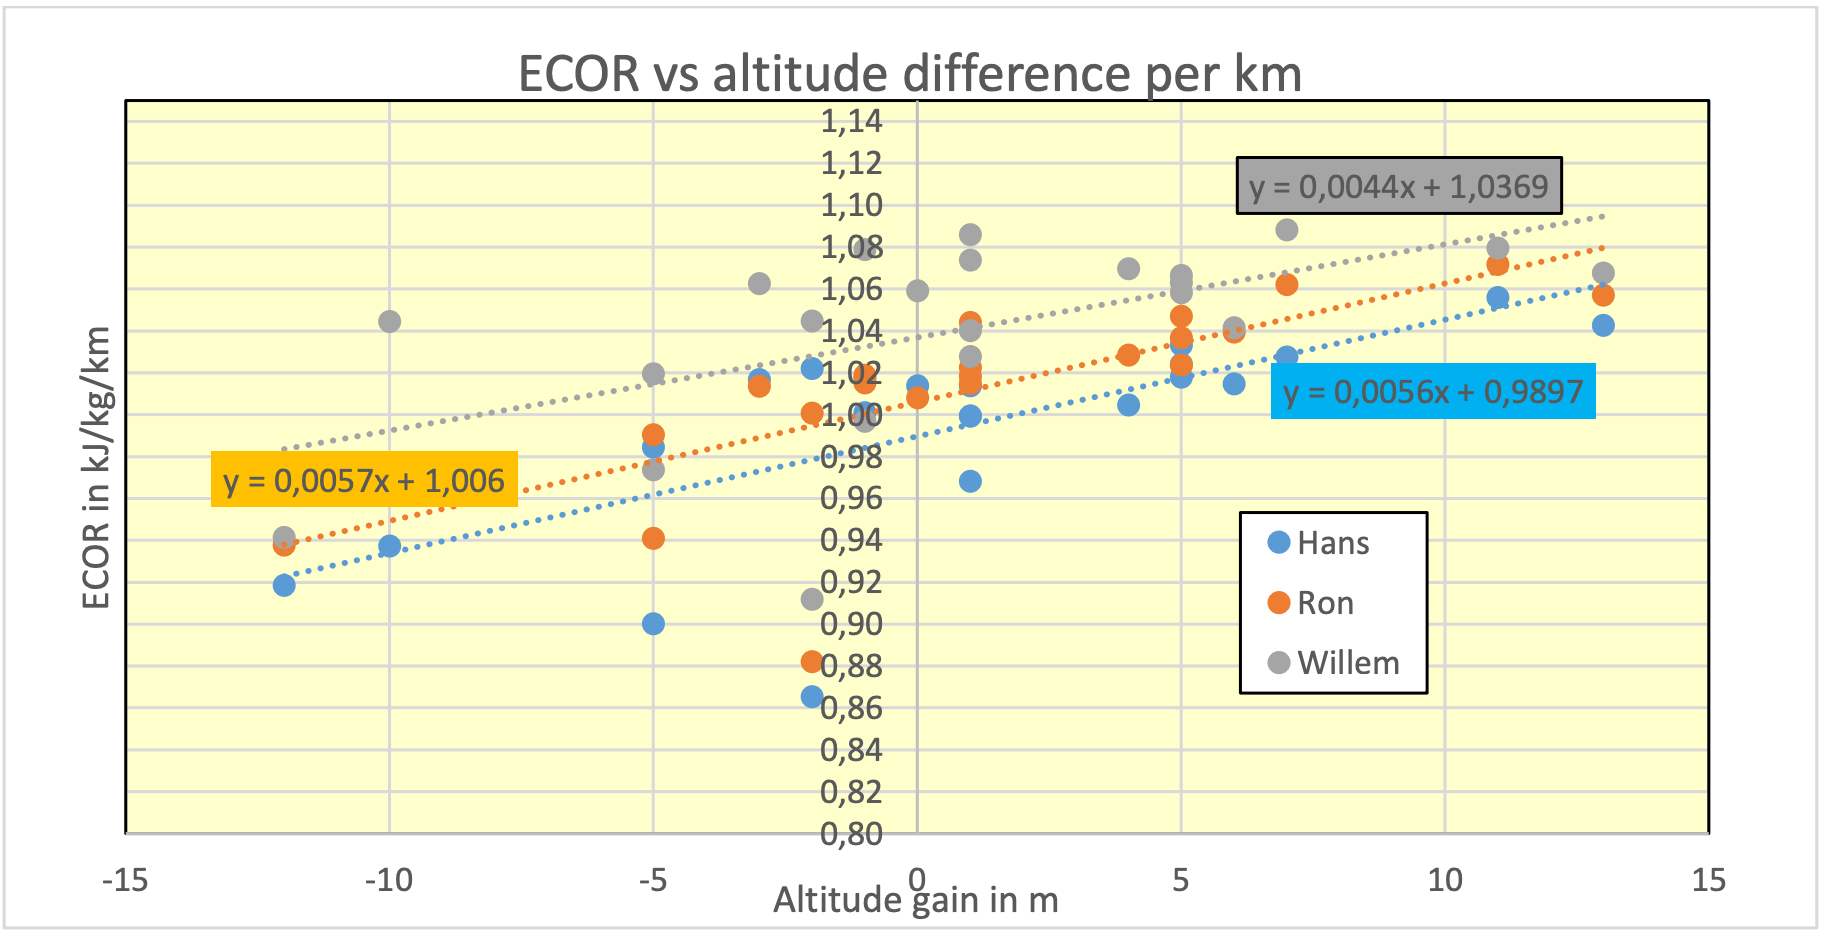
The remarkable pattern in the figure above is primarily caused by the altitude differences in the course. In our paper no. 17 (https://blog.stryd.com/2019/12/17/the-cost-of-running-up-and-down-hills/) , we showed that due to gravity uphill the ECOR is always higher. As it is always best to run at constant power, this means that uphill you should reduce your pace to maintain constant power. Downhill the reverse is the case. For the half marathon race, we have prepared the following relationship between ECOR and the altitude difference per km.

The figure clearly shows both the impact of the altitude differences and the consistent differences between the 3 runners.
Impact of fatigue on power output
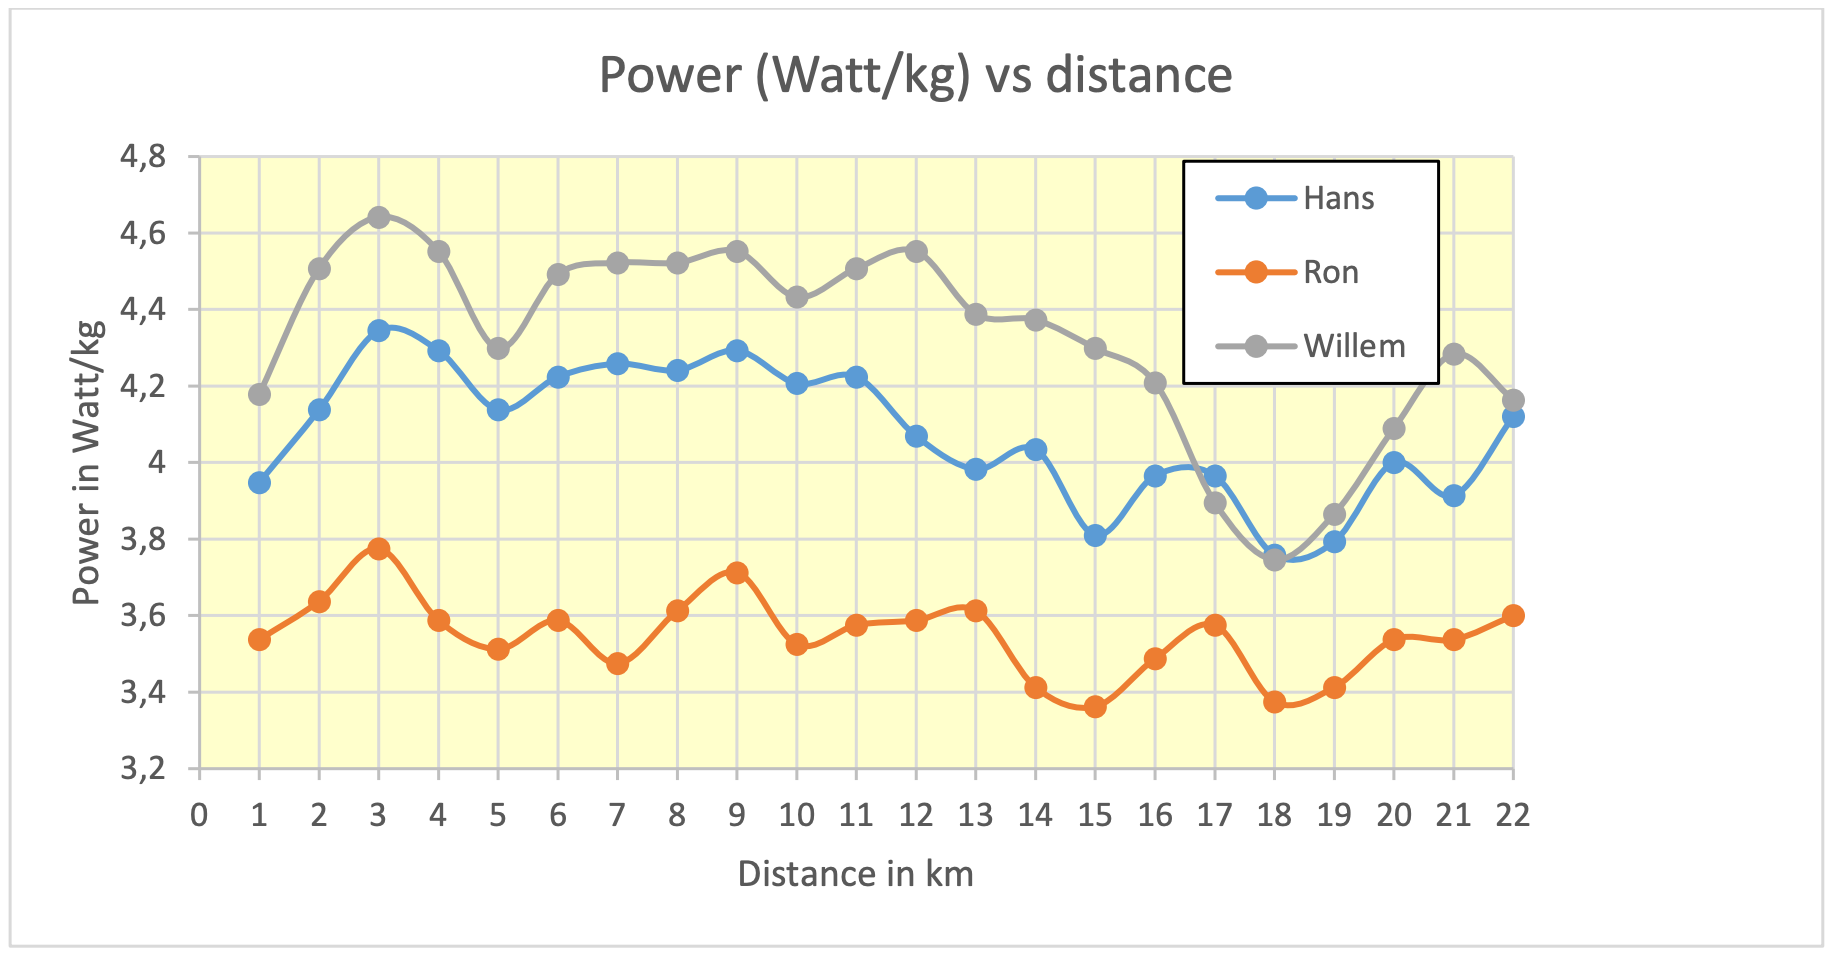
As we stated before, the conditions were tough, so the runners really struggled in the final parts of the race. This is illustrated by the relation between power (in Watt/kg) and distance.

The figure proves that Willem and Hans suffered severely from km 13 onwards (this was also the part where they faced the strong head wind). Ron proved better capable of maintaining his power output.
Impact of fatigue on LSS
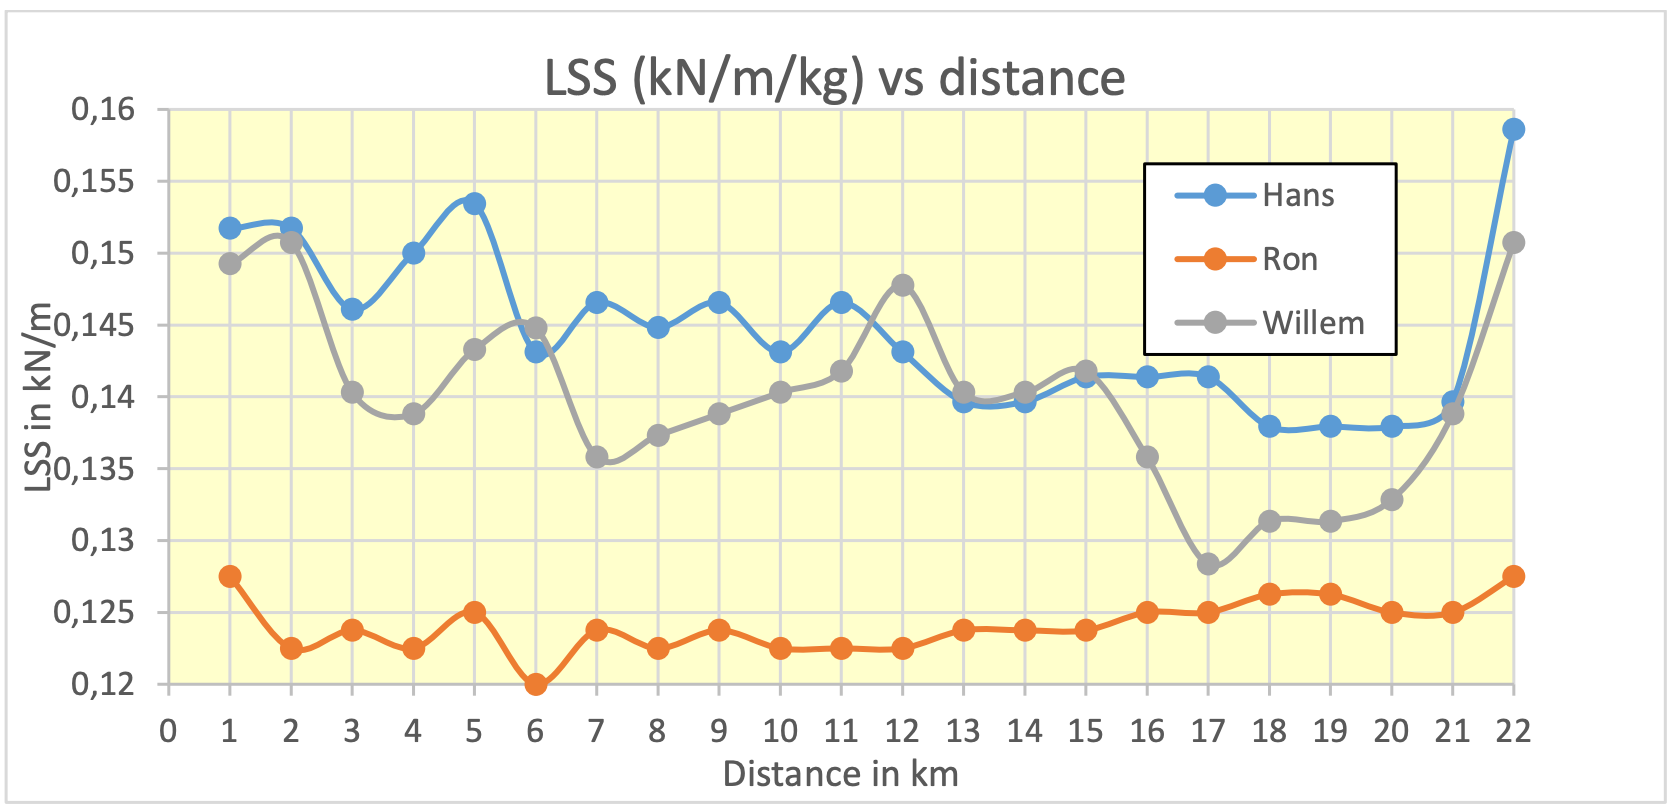
In order to make a realistic comparison of the LSS values of the 3 runners, we have divided the LSS by the body weight of the runners (Willem 67 kg, Hans 58 kg, Ron 80 kg). The figure below shows a similar picture as the one before: the LSS of Willem and Hans went down severely after 13 km, whereas Ron was able to maintain his LSS.

Discussion and conclusions
The analysis of the race has revealed some clear results: our 3 runners differed some 4% in ECOR (1.00-1.04 kJ/kg/km). This difference was consistent throughout the race, despite the large variations in ECOR-values which were caused by the altitude differences. The 4% difference is remarkable and raises the question to what extent the difference can be related to the running style. We believe it is worthwhile to investigate the conditions of the most economical running style, i.e. with the lowest value of ECOR.
The results also revealed the clear impact of the tough conditions of the race. Due to fatigue (and partly due to the head wind) Willem and Hans were not able to maintain their pace, power output and LSS.
Of course, there are still a number of buts…
First, this is just one experiment, so it needs to be verified by other experiments. We will certainly do this, and we hope other Stryders will follow our example. Second, we do not know yet to what extent these results depend on the running style of Willem, Hans and Ron. Other runners may get different results. In spite of these limitations, we are very excited that the Stryd provides us with an opportunity to determine our ECOR on a daily basis so we can try to optimize our running style. We are sure that this will pave the way to concrete improvements in our ECOR and race results. We hope that many readers will join us in this effort. Let’s share our data and conclusions on how we can measure and improve our ECOR! We are curious to the reactions and experiences of the readers, we welcome you to share these at www.thesecretofrunning.com.
If you would like to purchase The Secret of Running (or the German version, Das Geheimnis des Laufens), you can do so at the bottom of store.stryd.com.

