
How to analyze a 10K race: a case study


Earlier, we have analyzed the Stryd power data during the 7Hills race (https://blog.stryd.com/2019/12/17/an-in-depth-analysis-of-a-15k-race-seven-hills-run/) and the Dutch Indoor Master Championships 3000 meter race (https://blog.stryd.com/2019/12/17/impact-of-illness-and-injury-on-critical-power/). Both Hans van Dijk and Willem de Weerdt participated in the Dutch Master Championships 10 km Road Race at Schoorl, the Netherlands. In this paper, we will present their results. We have performed a critical analysis of the Stryd power data and conclude that they provide a consistent, clear and reliable picture of the conditions of the race and the performance of the runners. Furthermore, we have tried to assess the meaning and interpretation of the new running dynamics data Form Power (FP) and Leg Strength Stiffness (LSS).
The 10 km race at Schoorl and the results
The 10 km race is organized in the coastal area of the Netherlands, so the runners are faced with the crossing of some dune hills. The altitude profile of the run is given below.
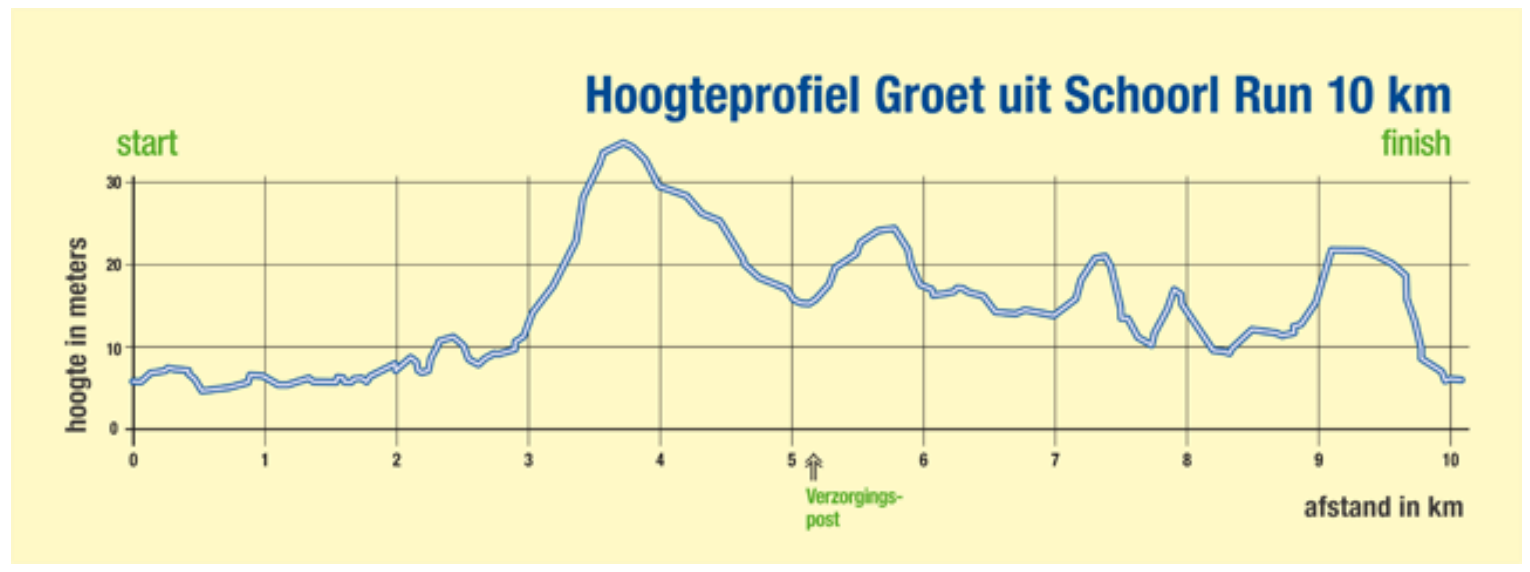
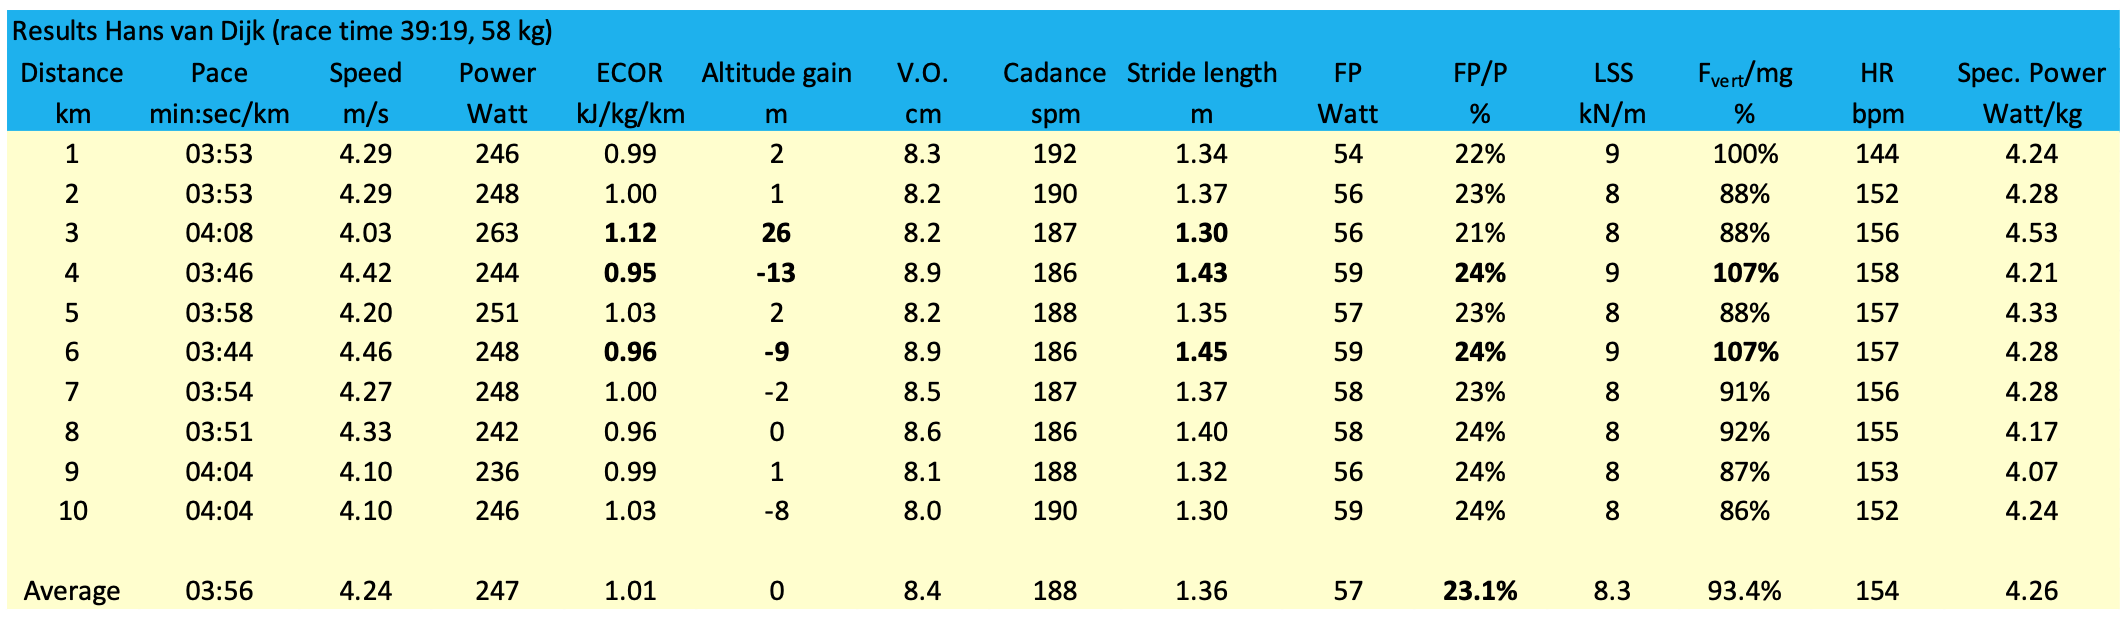
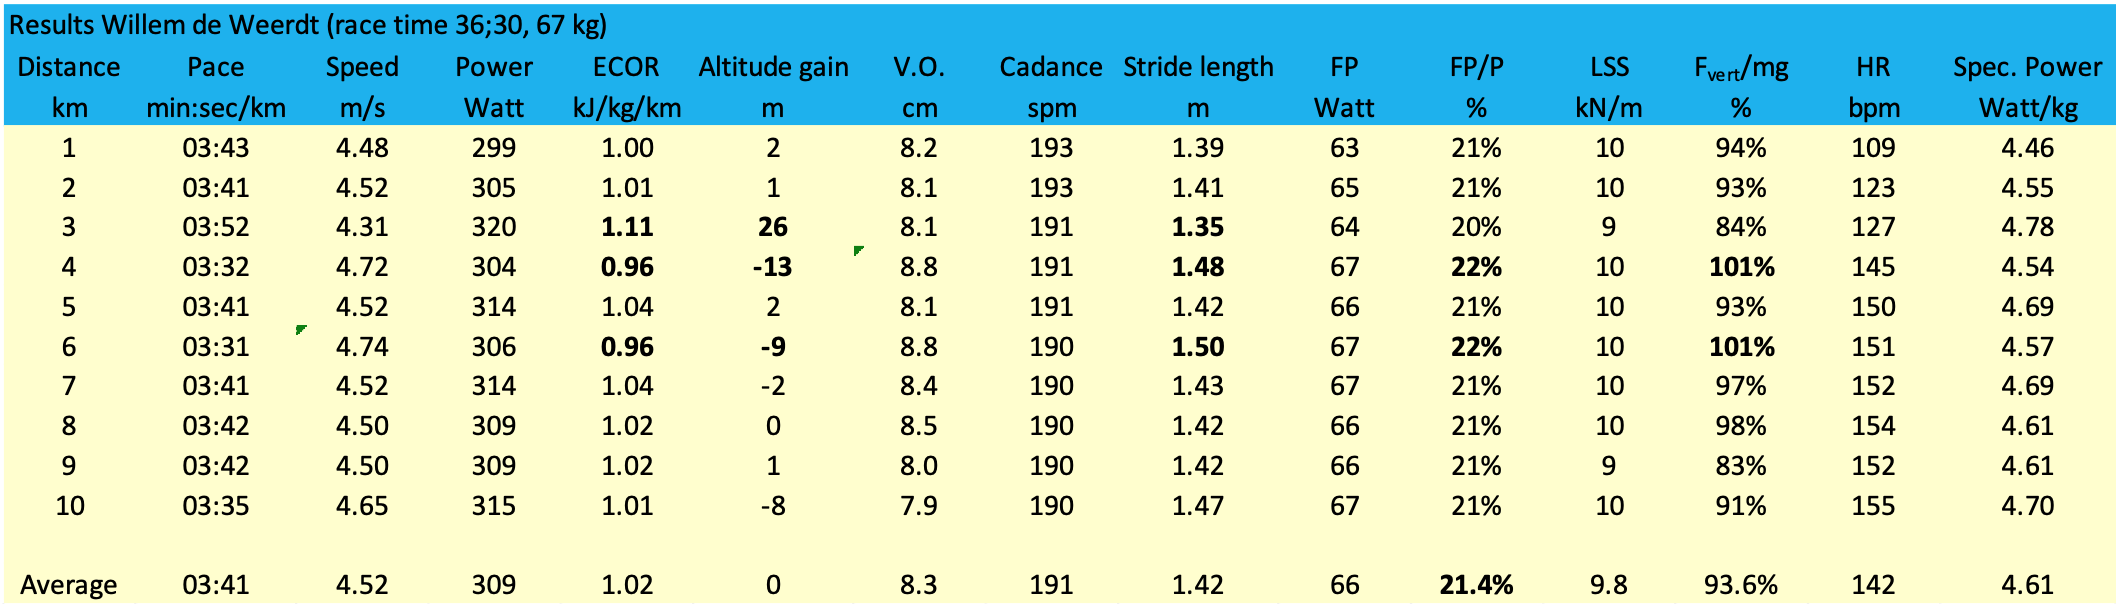
Hans and Willem are both 62 years of age, so they ran in the M60 age class. Willem finished 2nd in 36:30 and Hans 4th in 39:19. We have prepared a detailed analysis of their results in the tables below. We note that next to the Stryd Power data also the Garmin data (VO, cadence, stride length, HR) have been included.
Analysis of consistency and reliability of Stryd power data
The above tables clearly show that the Stryd Power data are quite consistent and reliable. The data of Hans and Willem are quite similar and so is the pattern during the race. As we have shown before in the paper on the 7Hills race, the power data and the Energy Cost of Running (in kJ/kg/km, calculated by dividing the unit power by the speed) reflect the impact of the hills perfectly. Uphill, the ECOR is higher and downhill it is lower, as a result of the impact of gravity. The average value of the ECOR is 1.01-1.02, so slightly above 1 on account of the hills
In the table we have indicated some striking results in bold. As could be expected we see that uphill the stride length is reduced and the reverse occurs downhill.
Calculation of the FTP and the performance index of Hans and Willem
In our book (www.thesecretofrunning.com) we have shown that the best indicator of the performance of a runner is the Functional Threshold Power, which is defined as the amount of power that a runner can maintain for 1 hour (in Watt or better in Watt/kg). Also we have shown that the power is proportional to the endurance time with an exponent -0.07. So, we can easily calculate the FTP from the power data of this race. As an example, we use the data of Hans. He maintained an average power of 247 Watt (or 4.26 Watt/kg) during 39 minutes, so his FTP is 247*(60/39)^-0.07= 240 Watt or 4.13 Watt/kg. In our book we have also shown how you can calculate your performance index, which is defined as your FTP divided by the FTP of the world record holder at your age class.
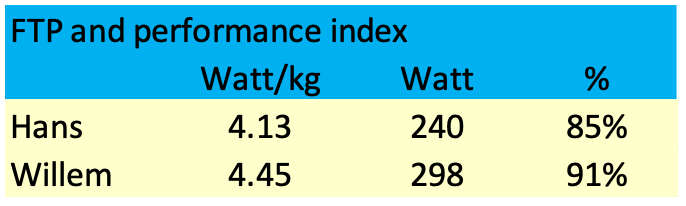
The table shows the results, indicating that Hans is a national level runner (performance index between 80-90%) and Willem is an international level runner (performance index between 90-100%). As we noted before, Hans is recovering from a bad winter, so his FTP may increase somewhat in the coming months.
Analysis of the differences between Hans and Willem and their running economy
The tables below presents the ratio of the average results of Hans and Willem.
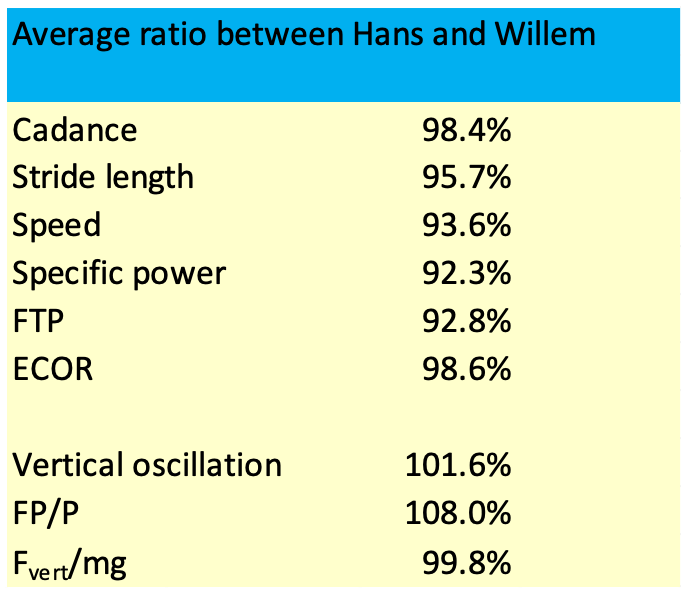
Obviously, the main result is that Hans was slower than Willem (pace 3:56/km vs 3:41/km, so the ratio of speed is 93.6 %). This is also reflected by his slightly lower cadence (188 vs 191 spm, so a ratio of 98.4%) and his lower stride length (1.36 vs 1.42 m, so a ratio of 95,7%).
In terms of power, we can conclude that the human engine of Hans produced somewhat less power during the race (4.21 Watt/kg vs 4.61 Watt/kg, so a ratio of 92.3%). This ratio of 92.3% is slightly lower that the speed ratio of 93.6%, which is caused by the fact that the Energy Cost of Running for Hans was slightly lower (1.01 vs 1.02 kJ/kg/km or a ratio 98.6%).
This ECOR is a very interesting parameter as it represents the running economy: how much energy do you use to run 1 km per kg of body weight? Obviously, every runner will want to run economically, so he will want to get this number down! So, how should we interpret this difference between Hans and Willem: does it mean that Hans is running slightly more efficient that Willem?
In truth, we have to confess that we really do not know this at this point yet.
First, we should recognize that the difference between the ECOR values is small.
Second, a poor running economy is usually associated with excessive vertical oscillation, but the v.o. of Hans is even (slightly) higher than Willem (8.4 vs 8.3 cm according to Gamin chest band data; 6.4 vs 6.3 cm according to Stryd foot pod data, or a ratio of 101.6%).
Third, a poor running economy is also being associated with a higher Form Power, but the ratio of Form Power to Power of Hans is even (slightly) higher than Willem (23.1% vs 21.4,1% or a ratio of 108%).
Fourth, a poor running economy is also being associated with lower Leg Stiffness Strength. In order to evaluate this, we have corrected the LSS for the body weight and the vertical oscillation (as LSS is defined as the vertical force Fvert divided the vertical displacement VO), so we have calculated vertical force as percentage of the body weight:
Fvert/mg= LSS/mg*v.o.
The result is that the calculated vertical forces are the same for Hans and Willem, both are close to 100% of their body weight.
Discussion and outlook
We conclude that the Stryd Power data provide a powerful, consistent and reliable information to analyze the conditions of a race and the performance of the runner. In particular the impact of altitude differences are represented perfectly in the data. As we have seen in the earlier papers, this provides runners with the opportunity to pace their race perfectly to maintain constant power. This way they can avoid ‘the red zone’ and achieve optimum results.
The question how the running economy can be optimized and the Energy Cost of Running (ECOR in kJ/kg/km) can be minimized is still a challenge to the running community. At this point if time, we find it hard to formulate solid conclusions on the optimum running style that minimizes the ECOR. Also we were not able to come to a logical and evidence-based conclusion on how the data on FP and LSS could be related to running economy. However, in all fairness, we should mention that we have seen clear differences with recreational runners (higher FP/P and lower LSS and Fvert/mg).
We will study running economy and the impact of running style on the ECOR in more detail in a research project with the Radboud University Nijmegen in the coming months, so we hope to be able to formulate solid conclusions later this year.
If you would like to purchase The Secret of Running (or the German version, Das Geheimnis des Laufens), you can do so at the bottom of store.stryd.com.