
Going Deeper: How Each Project Stella Athlete Contributed to the Record Setting Performance

Breaking a record over this distance isn't just about raw fitness. It's about efficiency.
On a per-athlete basis, we could see how each runner managed fatigue over 280+ miles, providing a window into how well the pacing strategy protected them from the kind of breakdown that can derail ultra-distance attempts and how each uniquely contributed to this record setting performance.
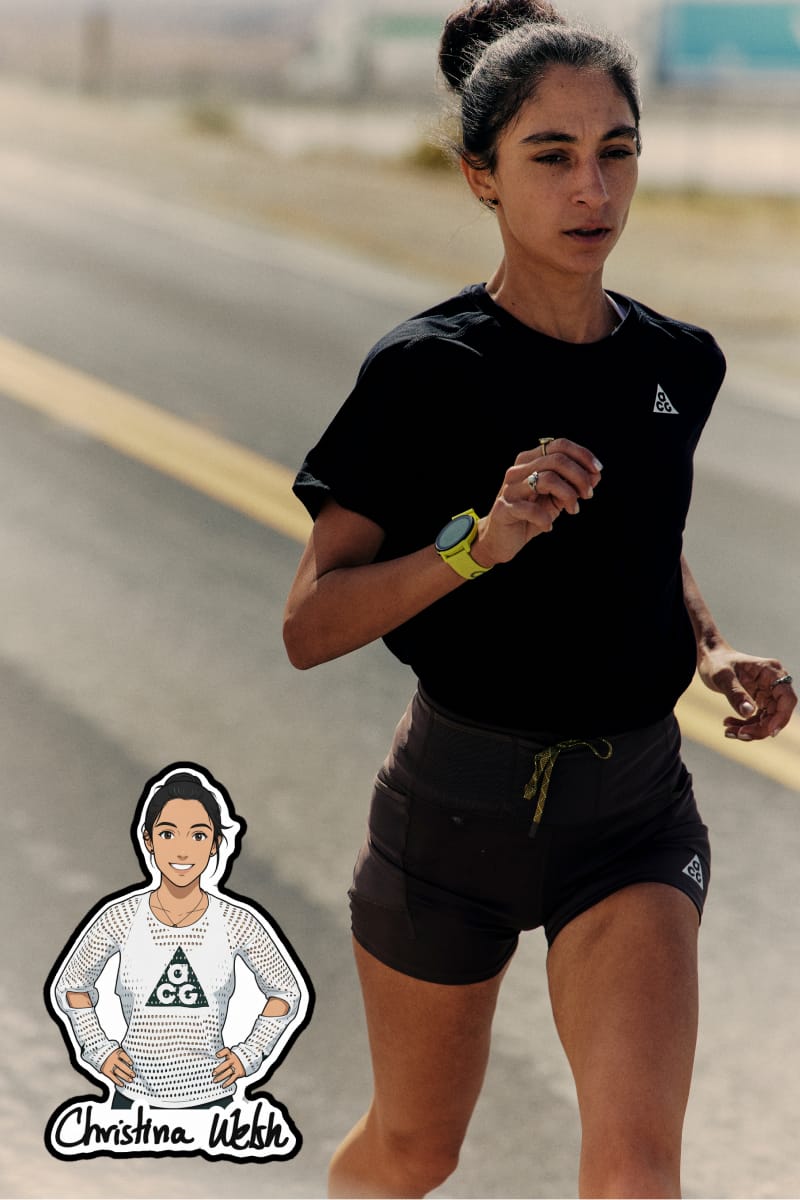
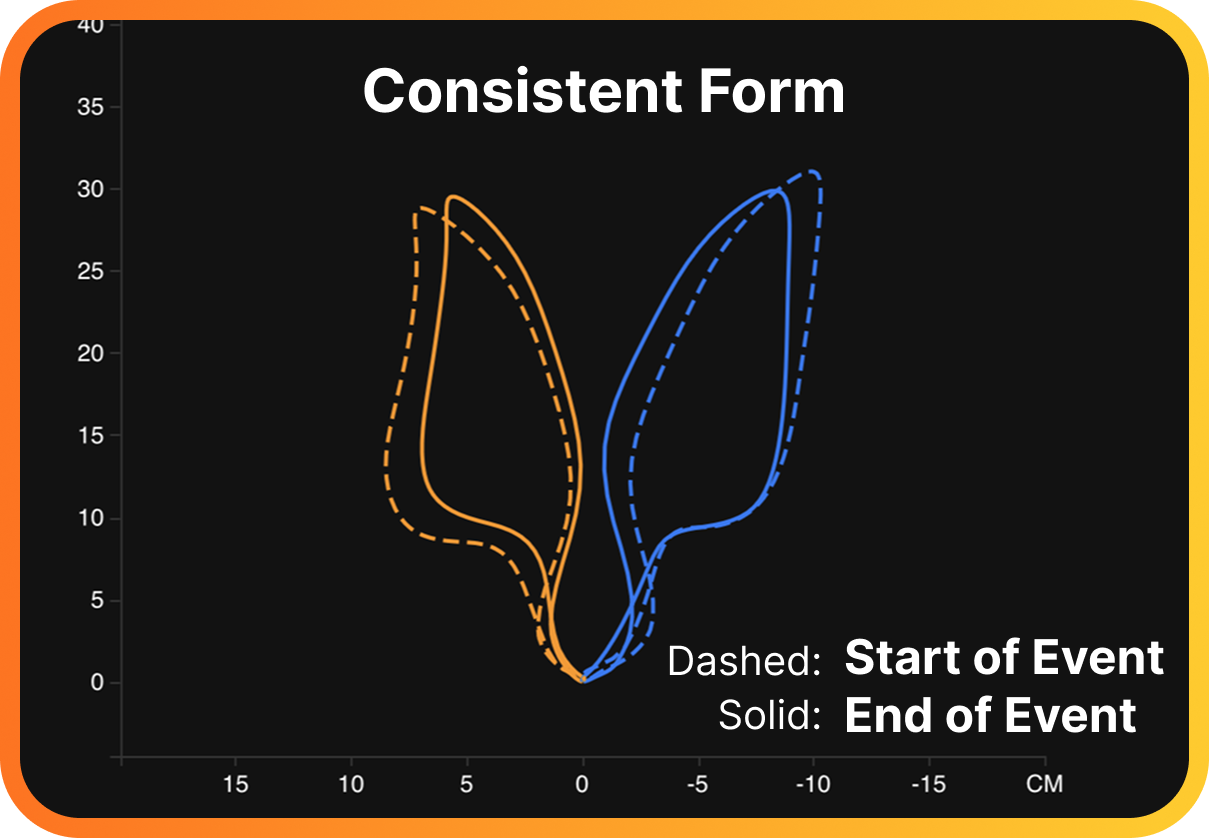
Christina: Most Consistent Performance & Form
Christina tied with Sophia for the highest average power on the team, coming in 2.5% above the group average. But what stood out most was her consistency. Her power output barely shifted from the first half to the second, and her running mechanics — Leg Spring Stiffness and general balance metrics — stayed remarkably steady across the entire event.
Interestingly, her footwear data revealed something worth noting: Christina responded better mechanically to the trail segments in Ultrafly shoes than anyone else on the team. Her Leg Spring Stiffness increased and her balance evened out on trails compared to road segments with Alphafly shoes, where she naturally carried more load on her right side. She was the most mechanically stable runner on the team from start to finish and delivered top-tier power output while doing it.
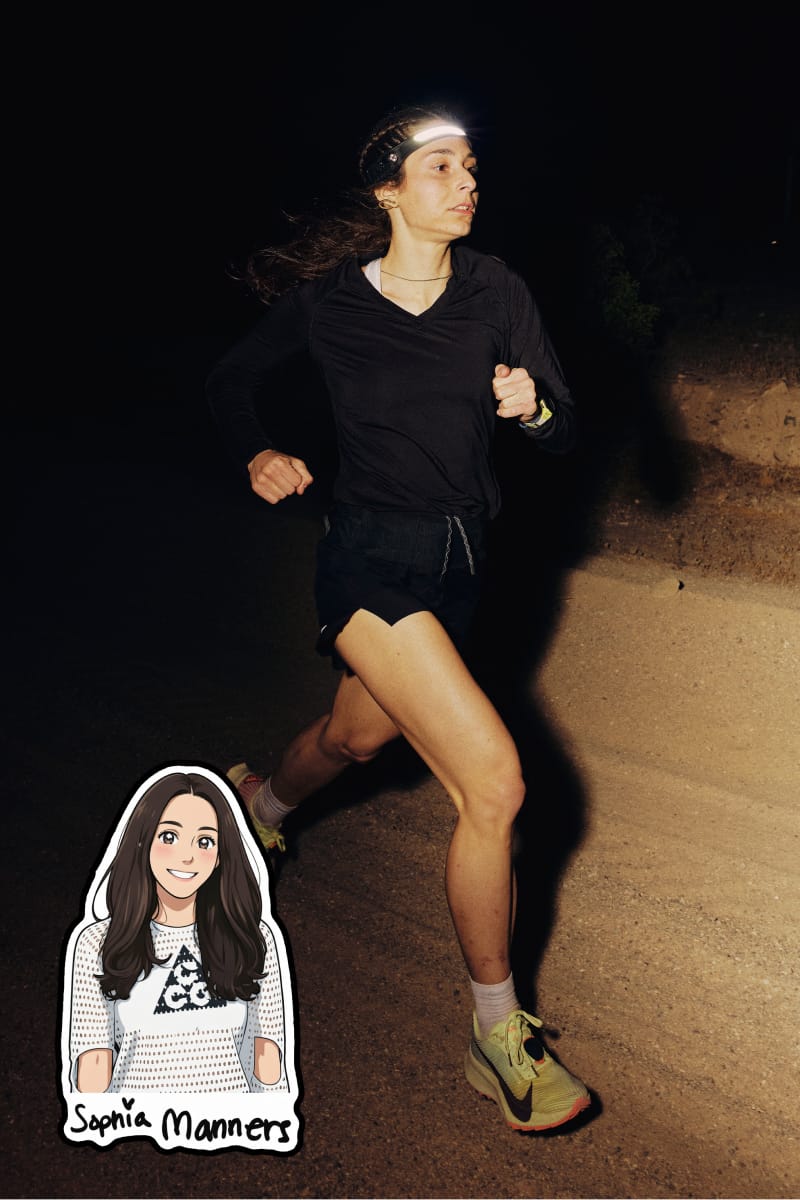
Sophia: Highest Power Output Despite Injury & Fueling Challenges
Sophia came into the race having recently qualified for the Olympic Trials at the Tokyo Marathon, and only running easy in the weeks leading up. She tied with Christina for the highest average power, 2.5% above the 304-watt group average but her path there was far rougher.

Sophia struggled with nutrition throughout and took a fall around mile 225 on the Powerline section of the course, aggravating her right ankle. The data showed it clearly: her left-right balance shifted up to 6% from normal in the second half as she compensated to offload force from the injured side. Her power did drop 8% from the first half to the second — but even with the fall, the ankle pain, and the fueling issues, she still posted the highest average output on the team. She fought through it.
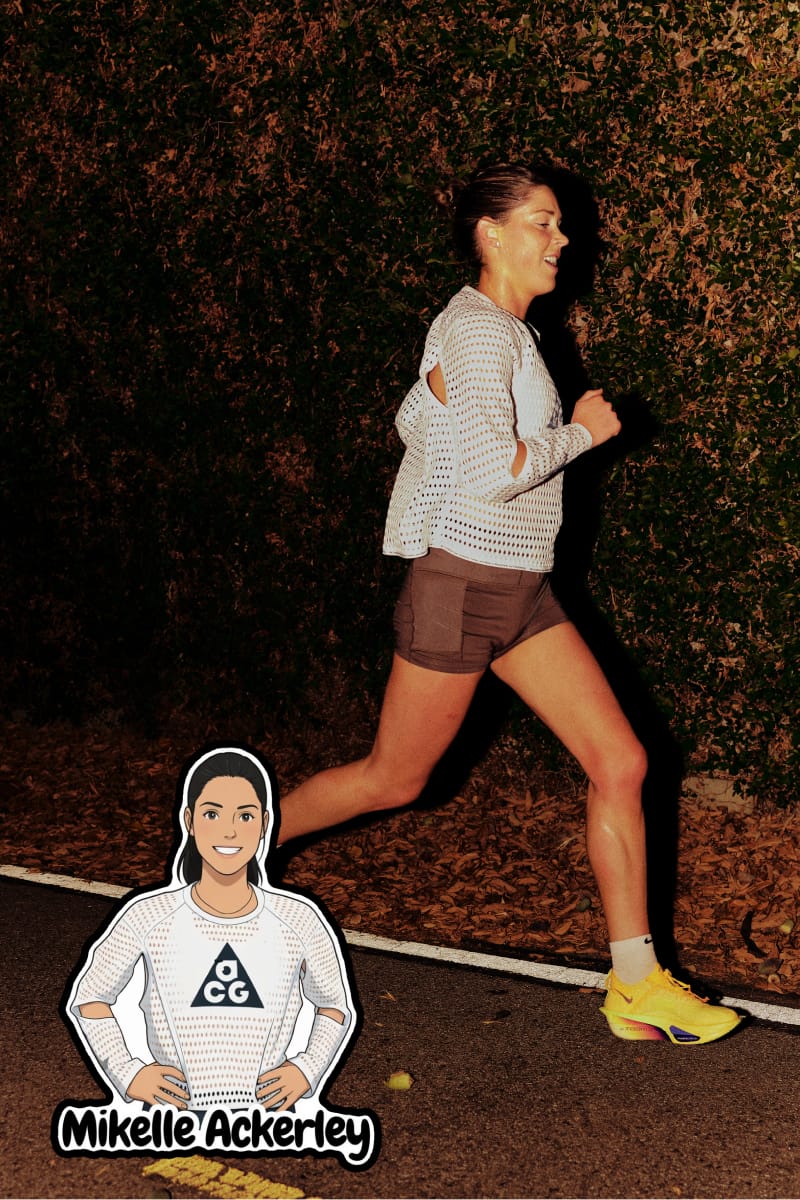
Mikelle: Overcame 8% Asymmetry Caused by Hamstring Pain
Mikelle was one of only two runners on the team with prior ultra and trail experience, and she needed every bit of it. Her right glute and hamstring started giving her problems 170 miles in on the start of the Powerline section, showing up in the data as an 8% shift in her left-right load balance — her right side wasn't absorbing force as effectively leading to significantly more uneven loading than normal.
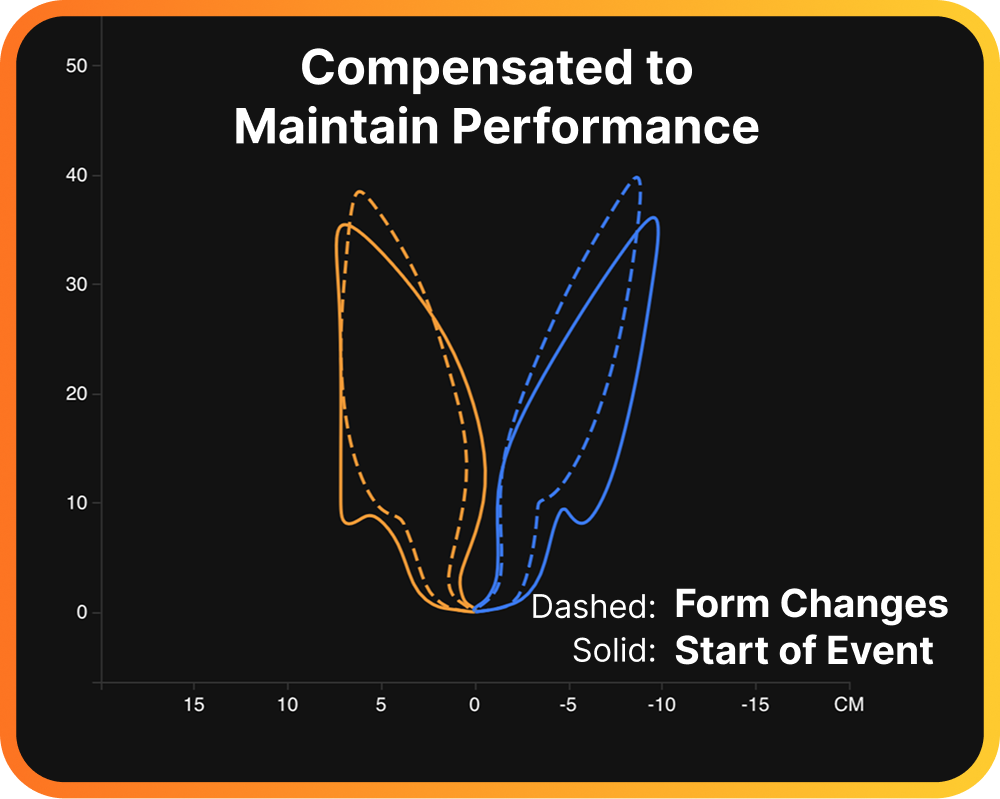
As the race went on, the pattern became a clear fatigue signature: with each segment in the second half, her asymmetry would grow by roughly 2%, correlating with the increasing strain on that right side.
Her power dropped about 6% from the first half to the second — less than some of her teammates — and she still matched the group average overall. Her Leg Spring Stiffness held steady throughout.
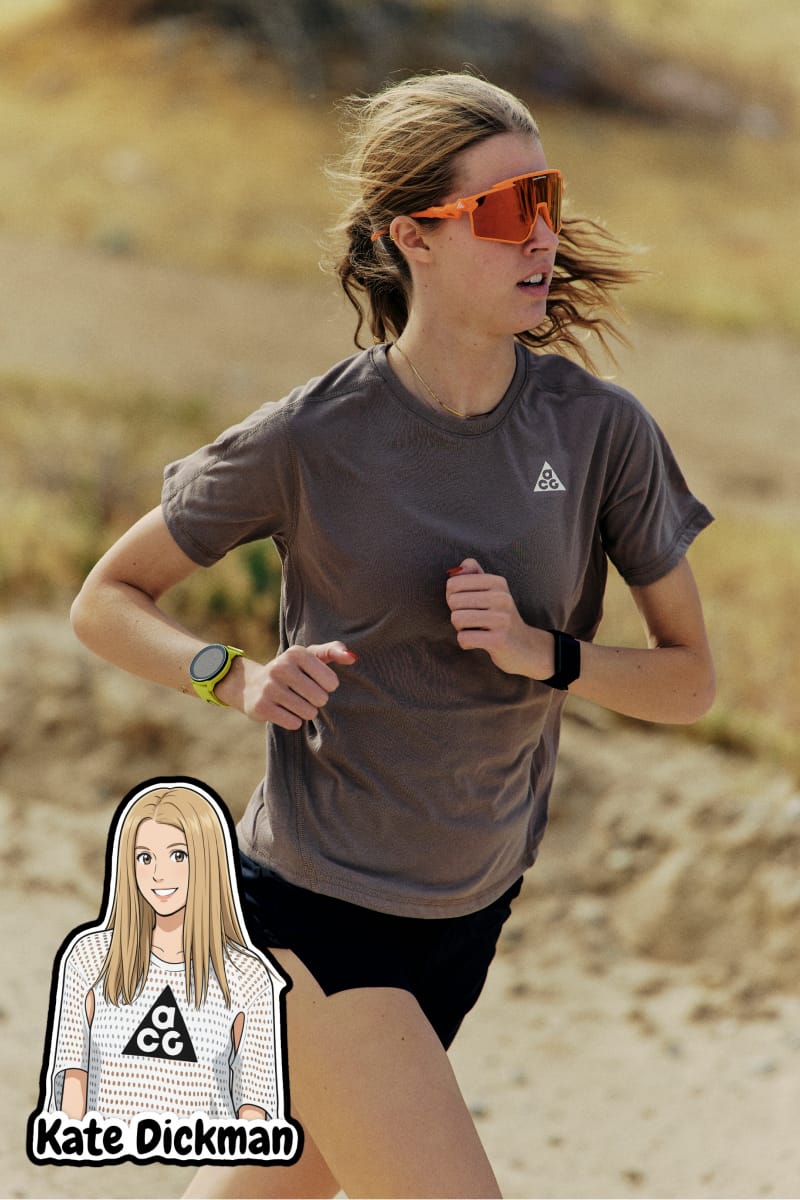
Kate: Kept Performance in Extreme Wind Sections, Maintained Even As Fatigue Continued to Grow
Kate came out strong in the first half, posting the highest power numbers — but the second half told a different story, with a 14% decrease in power output, the largest differential on the team.
The data pointed to the cause.

Her right groin began flaring up 200+ miles into the race at the end of the Powerline section, visible as a 3–4% shift in both her Impact Loading Balance and Leg Spring Stiffness balance — her left side picking up more force and producing more spring to compensate for her fading right side. Like Mikelle, this asymmetry grew by about 2% through each segment in the second half, a consistent fatigue signature of offloading the right side. In the final 29 miles, Kate’s balance metrics stabilized again, indicating the shorter reps help reduce the impact.
Despite all of that, Kate still matched the group average in power. Kate went into the race being the biggest wildcard: a history of impressive performances but she had only been running low mileage weeks since graduating college the previous spring, making her performance all the more impressive.
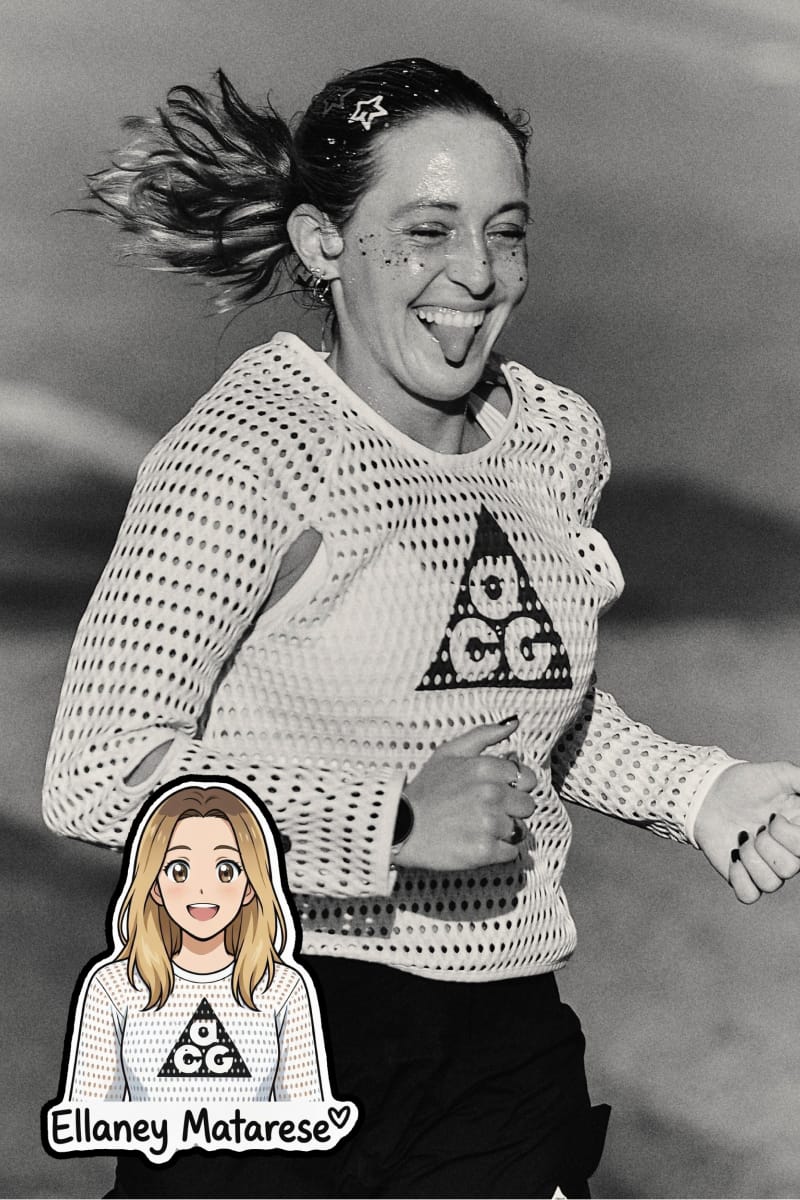
Ellaney: Ran Two Long 18+ Solo Segments, Enabling Needed Recovery for Rest of Team
Ellaney role was unique. While the rest of the team ran shorter relay-style intervals for most of the desert, Ellaney’s training demanded that she ran two solo segments of 18 miles each. These long continuous efforts turned out to be critical: allowing the other runners critical recovery time.

That came at a cost. Her average power was the lowest on the team, about 6% below the group average, but the context matters: running two segments of that length demands a more conservative effort than short, fast intervals. Her Leg Spring Stiffness dipped after the second long effort reflecting the accumulated fatigue but rebounded with rest, showing her body could recover when given the chance.
Her power output stayed consistent throughout — she paced herself well and enabled the rest of her team to run faster.
Hanna: Strong Consistent Performance Just One Week after OTQ Marathon
Hanna had run an Olympic trials qualifier at the McKirdy MicOTQ marathon just one week before the race and had barely run since. The data was encouraging: her segments showed clean, strong mechanics and solid power output.

For a runner on one week of recovery from a peak marathon effort, she looked good — and contributed exactly what the team needed from her.