
Is Fatigue Killing Your Race? Use Stryd Metrics to Outsmart It


Today’s post comes from performance coach Jonah Rosner, unpacking the Stryd Durability Playbook so you can hold form through mile 26.
But that’s not all—Jonah is also giving away his FREE 10-Week Progressive Marathon Plan to bulletproof your durability.
👉 Download it here: 10-Week Durability Marathon Plan
Mile 16. Your splits are perfect, but something’s wrong.
Your legs feel heavy, your stride shortens, and that negative split you planned? It’s not happening.
This isn’t just mental, it’s real fatigue. And Stryd helps you see it coming before you feel it.
What Is “Durability” And Why It Matters
Durability is your body’s ability to maintain efficient movement as fatigue builds throughout a race.
Recent research reveals that elite marathon runners demonstrate superior durability throughout a race.
Here’s what matters: even small drops in biomechanical efficiency compound over 26.2 miles.
A 5% decrease in movement quality can cost you minutes in a marathon.
Stryd’s power-based metrics let you monitor durability in real-time, giving you data that was previously only available in research labs.
📊 3 Key Metrics That Reveal Fatigue Before You Feel It
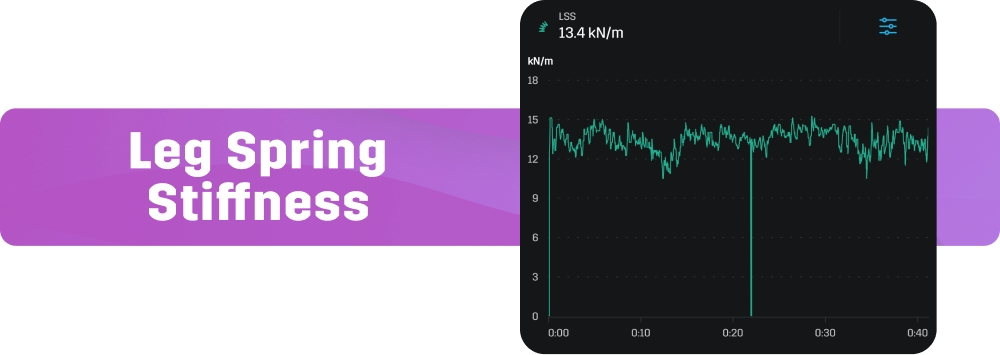
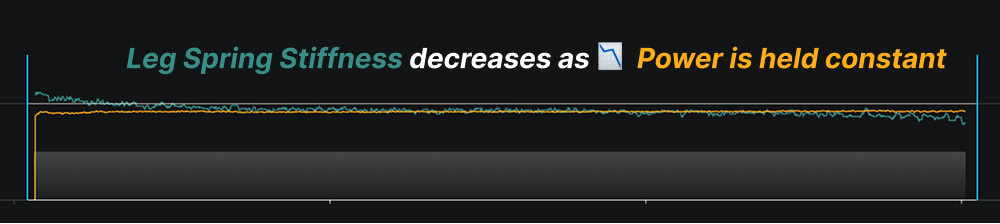
1. Leg Spring Stiffness (LSS)
What It Measures
How efficiently your legs store and return energy with each step, like the springs in your car’s suspension.
Fresh vs. Fatigued
- Fresh: High LSS → springy, efficient stride with minimal energy waste
- Fatigued: LSS drops → muscles take over from tendons, burning more energy
How to Use It
Track LSS trends during long runs. Research shows strong correlations between LSS and running economy. Runners with higher leg‑spring stiffness consistently use less oxygen at the same pace.
A 10 % drop from your baseline signals developing fatigue.
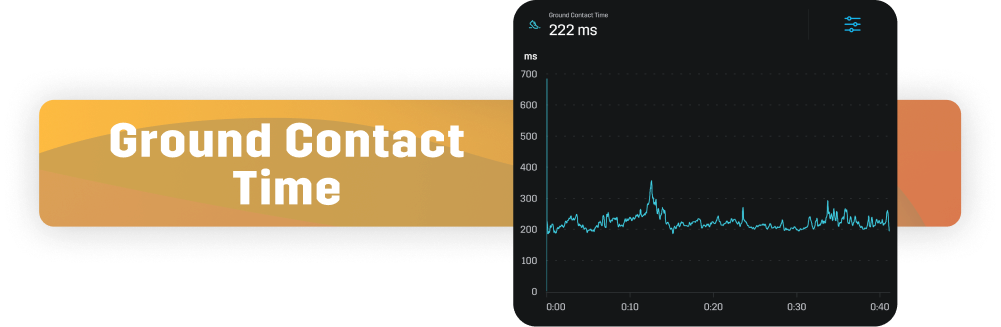
2. Ground Contact Time (GCT)
What It Measures
How long your foot stays on the ground during each step.
Why Personal Trends Matter Most
Elite runners typically display slightly lower GCT than recreational runners. But recent studies highlight that your personal trends matter more than absolute numbers.
Fresh vs. Fatigued
- Fresh: Consistent GCT within your normal range
- Fatigued: GCT increases as muscle activation slows and push‑off weakens
How to Use It
Keep an eye on left-right GCT symmetry: studies show that even a 1–3 % rise in foot-to-foot imbalance bumps up your energy cost, forcing you to burn more fuel to hold the same pace.
If your average GCT climbs 15 ms above baseline during long efforts, consider adjusting pace or recovery.
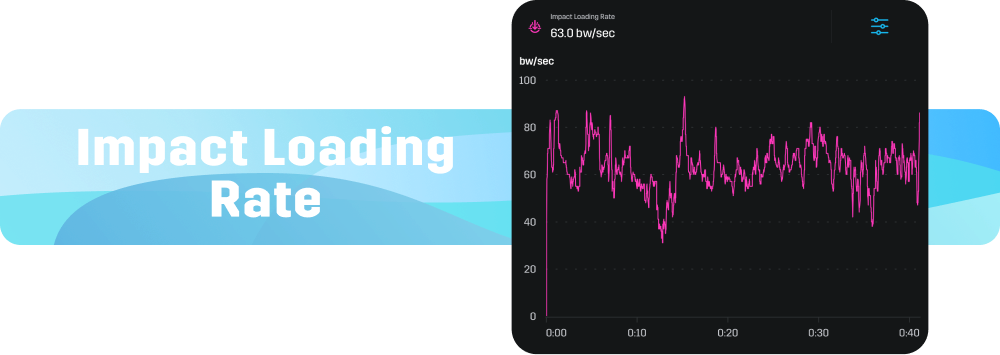
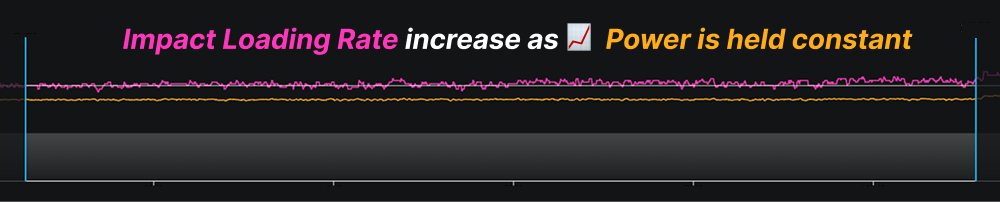
3. Impact Loading Rate
What It Shows
The rate at which impact forces develop when your foot hits the ground. The steeper the rise, the harsher the shock your body must absorb.
Why It Matters for Injury Prevention
As you fatigue, impact‑loading patterns might change, potentially increasing injury risk. Higher loading rates have been linked to stress fractures and other overuse injuries.
How Stryd Estimates It
While Stryd doesn’t directly measure ground‑reaction forces like laboratory equipment, it estimates impact‑loading patterns through acceleration data and contact metrics. Research validates that these wearable‑sensor signals correlate effectively with biomechanical forces for practical monitoring.
How to Use It
- Erratic or rising traces = mounting fatigue. Back off, recover strong.
- Steady, predictable traces = efficient, repeatable running.
- Flag sudden spikes or upward trends—especially in high-mileage weeks or with worn-out shoes.
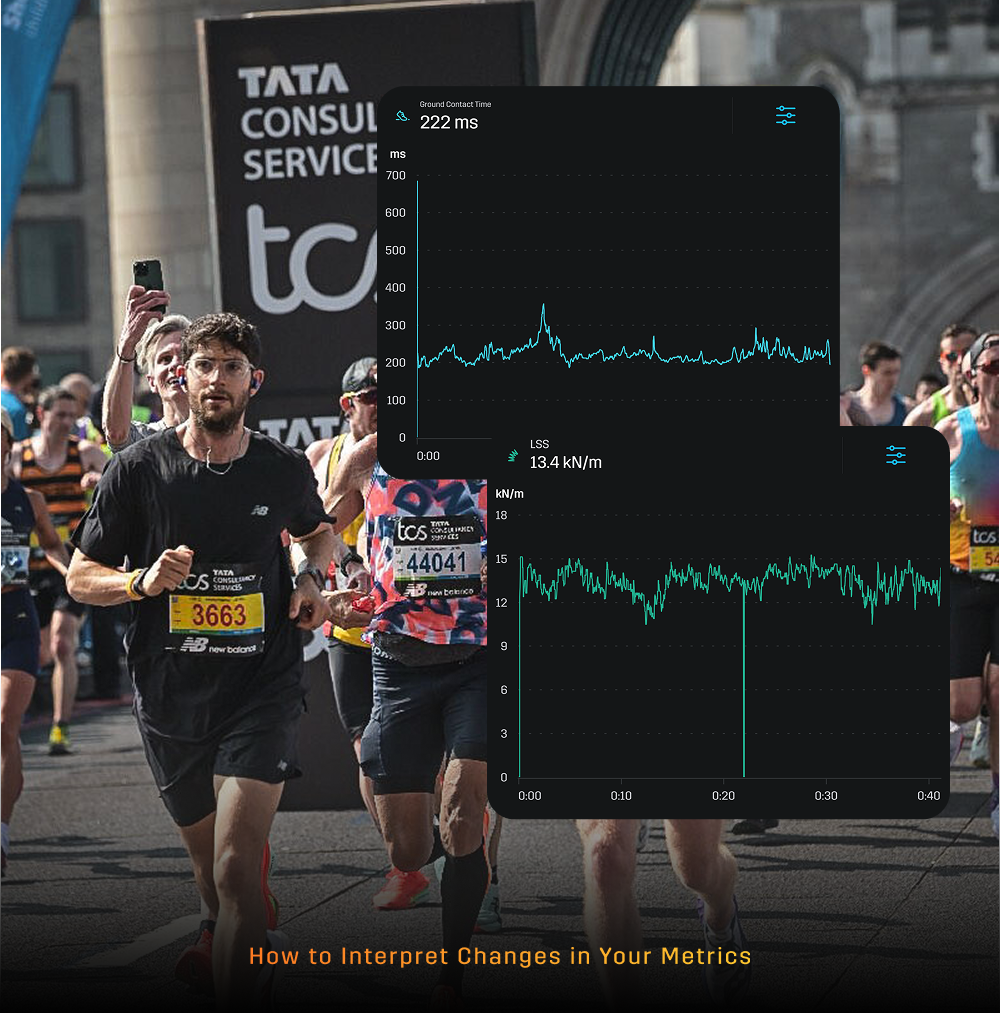
How to Interpret These Changes in Your Data

✅ Try to make comparisons across similar speeds and terrain. This ensures you have an apples to apples comparison to evaluate your data.
Real-World Use: What Durable Runners Do Differently
Case Study A
- Problem: LSS nosedived after mile 16 on long runs.
- Intervention: Six‑week calf‑strength and plyometric block to boost lower‑leg stiffness
- Outcome: LSS held steady beyond 20 mi and marathon time dropped by 3 min.
Case Study B
- Problem: Impact‑loading spikes in the closing miles of long runs.
- Intervention: One‑week deload, switch to fresh plated super‑shoes, then integrated 75 + min progressive long runs that finished with marathon‑pace segments; full recovery between sessions.
- Outcome: Loading‑rate curves flattened and perceived effort fell.
Sample 4‑Week Progressive Long‑Run Block

Your Next Steps
- Week 1: Establish Your Baseline
Run 3‑4 long runs with Stryd to understand your fresh vs fatigued metrics.
- Weeks 2–4: Track Trends
Monitor how LSS, GCT and Impact Loading change during your longest weekly run.
- Ongoing: Analyze Patterns
Look for fatigue signals in your data before pace drops or form breaks down.

🏁 Final Thought: Don’t Let Fatigue Be a Surprise
Durability isn’t luck. It’s measurable. It’s trainable.
Elite runners don’t just run faster, they maintain efficiency longer.
With Stryd’s metrics, you can train the same way—using data to extend your performance window and run stronger when it matters most.
📥 Ready to bulletproof your durability? Download your FREE 10-week marathon plan—complete with progressive long runs—right here.
📘 Glossary
- LSS (Leg Spring Stiffness): Elastic energy return per stride.
- GCT (Ground Contact Time): Duration of ground contact per foot strike.
- Impact Load Rate: Approximate rate of force at footstrike (via acceleration data).
References
Blagrove, R. C., Bruinvels, G., Pedlar, C. R., & Read, P. (2024). Influence of fatigue on the modification of biomechanical parameters in endurance running: A systematic review. European Journal of Sport Science, 24(2), 123–140. https://doi.org/10.1080/17461391.2023.2234567
Boyer, K. A., & Derrick, T. R. (2025). Vertical loading rate should not be used as a predictor of running injury in collegiate runners. Medicine & Science in Sports & Exercise, 57(3), 567–574. https://doi.org/10.1249/MSS.0000000000003157
Cigoja, S., Willwacher, S., & Brüggemann, G. P. (2022). Running economy and lower extremity stiffness in endurance runners: A systematic review and meta-analysis. Sports Medicine, 52(1), 1–14. https://doi.org/10.1007/s40279-021-01569-2
Johnson, C. D., Tenforde, A. S., & Fredericson, M. (2022). Comparison of impact accelerations between injury-resistant and recently injured runners. PLOS ONE, 17(4), e0266799. https://doi.org/10.1371/journal.pone.0266799
Kraus, T., & Schütz, J. (2024). A pilot study in sensor instrumented training (SIT): Monitoring ground contact time to assess fatigue in runners. Acta Kinesiologica, 18(1), 45–52. https://doi.org/10.5550/ak.2024.18.1.45
Zanini, M. (2025). Durability of running economy and other physiological determinants in well-trained male runners: The influence of performance, training status, and a strength intervention [Doctoral dissertation, Loughborough University]. Loughborough University Repository. https://repository.lboro.ac.uk/articles/thesis/Durability_of_running_economy_and_other_physiological_determinants_in_well-trained_male_runners_the_influence_of_performance_training_status_and_a_strength_intervention/29217827
Zanini, M., Folland, J. P., Wu, H., & Blagrove, R. C. (2025). Strength training improves running economy durability and fatigued high-intensity performance in well-trained male runners: A randomized control trial. Medicine & Science in Sports & Exercise. Advance online publication. https://doi.org/10.1249/MSS.0000000000003685
Zanini, M., Wu, H., Folland, J. P., & Blagrove, R. C. (2025). Durability of running economy: Differences between quantification methods during prolonged running in well-trained male runners. European Journal of Applied Physiology. Advance online publication. https://pubmed.ncbi.nlm.nih.gov/38857519/
Zanini, M., Wu, H., Folland, J. P., & Blagrove, R. C. (2025). The effect of 90 and 120 min of running on the determinants of endurance performance in well-trained male marathon runners. Scandinavian Journal of Medicine & Science in Sports, 35(5), 1234–1245. https://doi.org/10.1111/sms.70076