
Closer Look: Go in-depth with new post-run analysis & metrics in the Stryd mobile app


You will be eager to analyze your data after every run with our simple analysis tools that enable you to go in-depth.
Stryd's mobile app now has a full suite of tools to make your post-run analysis easy and thorough.
You will find new metric displays, new split-by-split graphs, and a new lap table.
Let's take a look at the new features!
Analyze all of your Stryd data with the new metric display
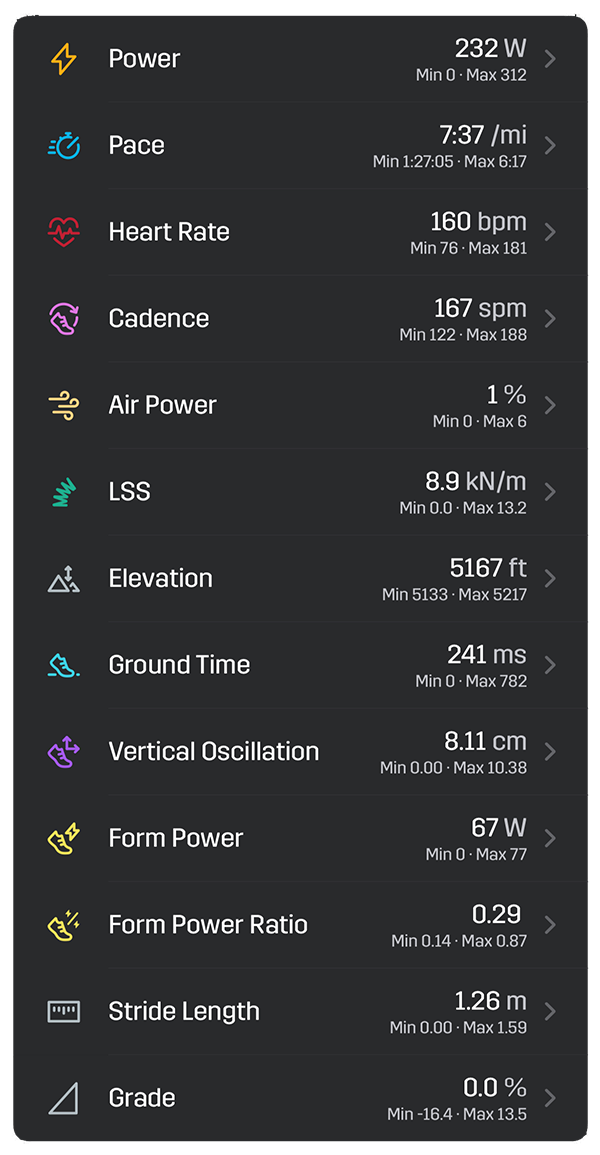
We now comprehensively present all of your Stryd data in the mobile app.
There are a few new metrics too.
Stride Length: Stride Length is the distance you cover from one foot fall to the next. You can use this metric in combination with cadence to understand why your running speed is changing.
Grade: Grade is the average slope of a given segment. You can use this to see how power is impacted by uphills and downhills.
Form Power Ratio: Form Power Ratio is Form Power divided by Power. You should analyze this metric after endurance workouts to spot trends in how Form Power impacts Power output.
Tip: You can customize the metric display. You can hide the metrics you don't care about and keep the important metrics you need for analysis.
Zoom in on the sections that matter with split views
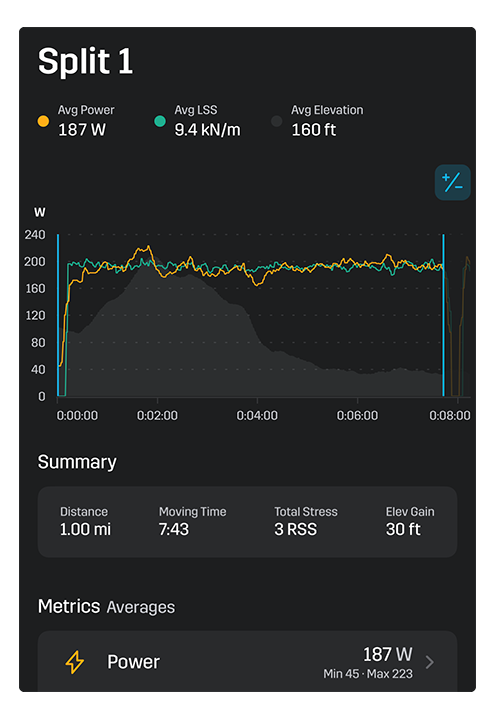
The new split view enables you to narrow in on the important sections of your run.
You can customize the graph to show as much or as little data as you want to make your analysis fast or in-depth!
Tip: Tap and hold on the graph to view second-by-second data.
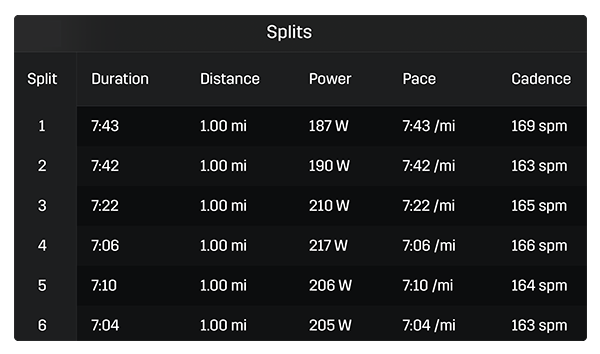
The new scrolling lap table fills your entire screen with your Stryd data
You can quickly scroll through every lap of your workout and every Stryd metric with speed and ease.
This is a great view to use when analyzing a steady state run or race where you had auto-laps enabled on so you can see how consistent your power output was or how metrics like Leg Spring Stiffness and Ground Time trended during your run.
Tip: Use the option key in the top right hand corner of this view to export a CSV file for further analysis in your own spreadsheet.
Getting Started
Getting started with Stryd’s post-run analysis is easy!
All you need to do is ensure you have the latest Stryd app and you will find these new analysis tools when you select a run.
Ensure you have updated to the latest version of the Stryd iOS app >>
Ensure you have updated to the latest version of the Stryd Android app >>
When: Wednesday, October 14 @ 3PM MT (GMT-6)
Where: Youtube: https://youtu.be/VuZuqyLZ6NE
Why: Evan Schwartz from the Stryd Team will show you how he analyze his running data using these new metrics & tools
Final Word
You can now go deep into your data on the Stryd mobile app with our new easy post-run analysis tools. We hope that this new update means that you are opening up the Stryd app first to analyze your data after every run!
Join the discussion on the Stryd Community >>
Order Stryd here >>
Best,
Stryd Team