
First Stryd Run With Matt, Triathlete & Software Developer

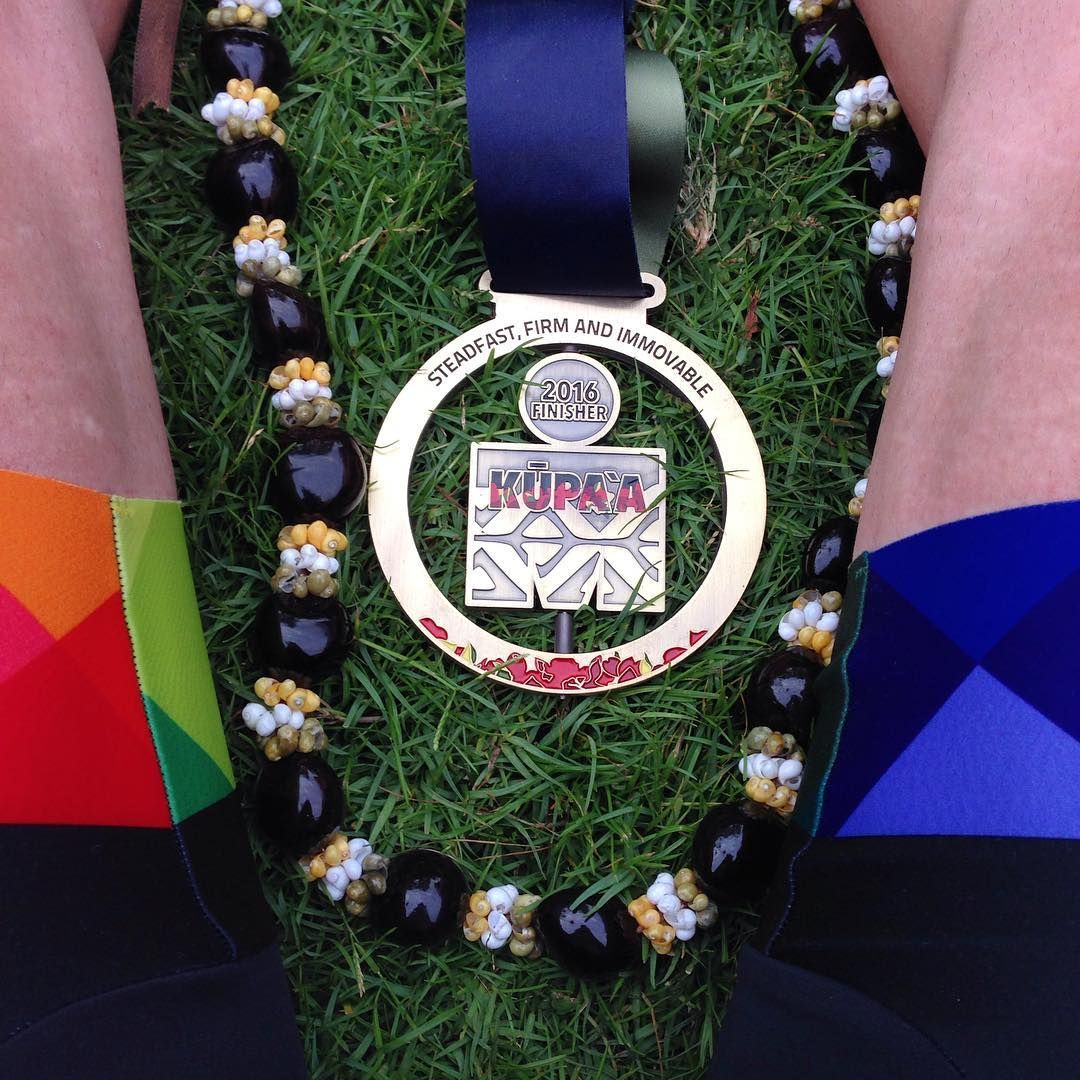
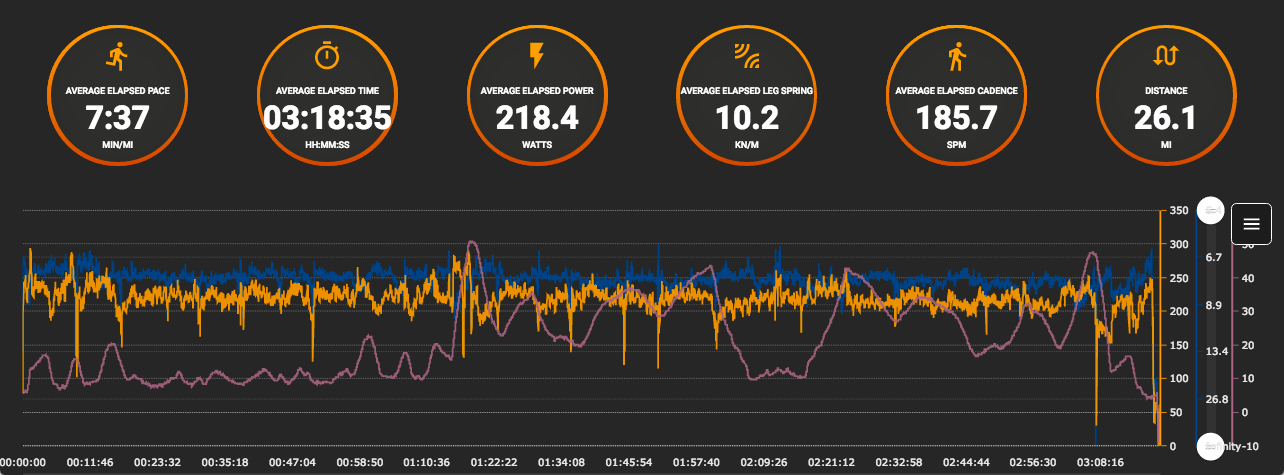
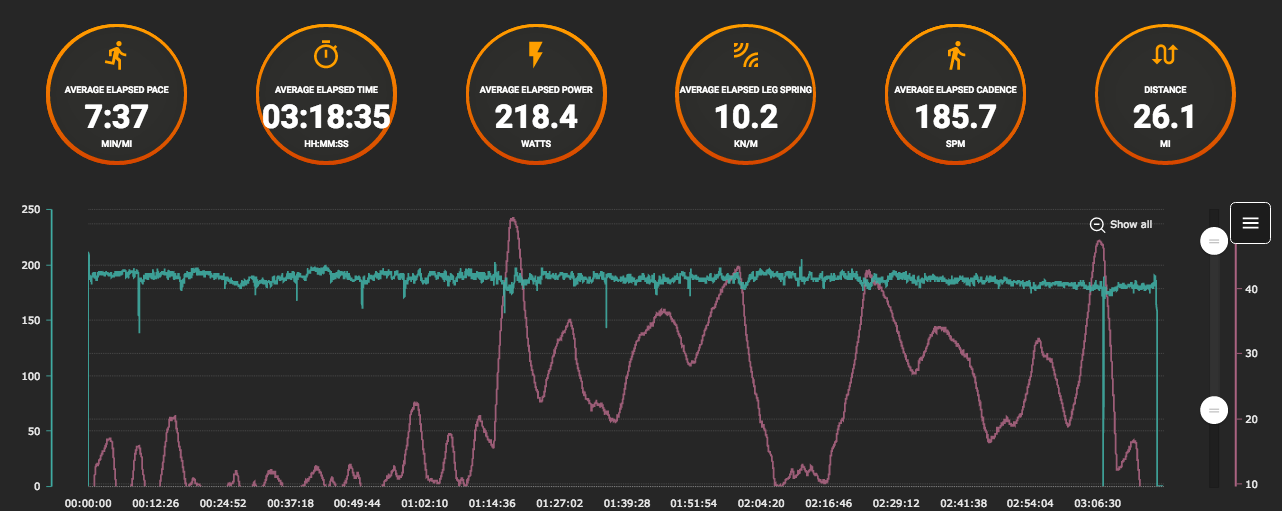
Overview of my Run: Power, Pace and Elevation
As a data geek, I liked the idea of collecting more data for my run. At least as a curiosity.
I collected a foot-pod - kindly lent by Stryd - a couple of days before the race, but I was only going to let it record data, and not attempt to change any settings on my watch to display any field that would confuse me during my race.
The pod wasn't perceivable at all on my shoe, and that unobtrusiveness is what convinced me to try it. I don't think I would have tried with the chest strap. It was only a case of clipping it on my laces and forgetting about it until giving it back for later data analysis.
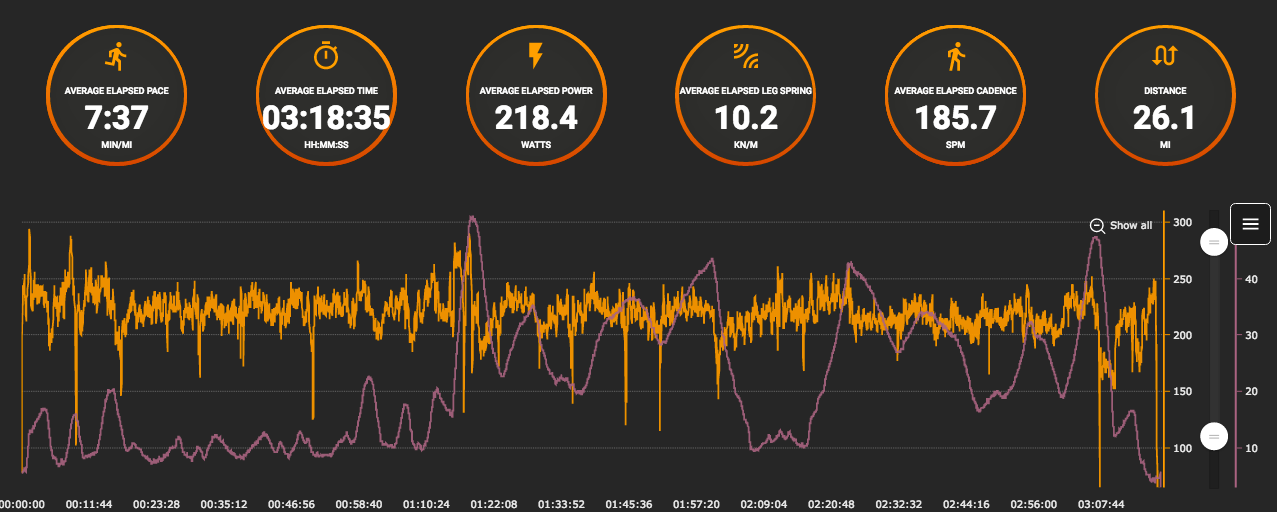
I felt pretty good going out of transition, and I settled quickly in my run. All "reasonable targets" went out of the window straight away and instead of starting slowly, I started at my target pace from other flatter races. Not crazy fast, but probably a bit too hard given the heat an humidity. Trying to maintain this over the first inclines did need some effort, and that's clearly visible on the power curve.
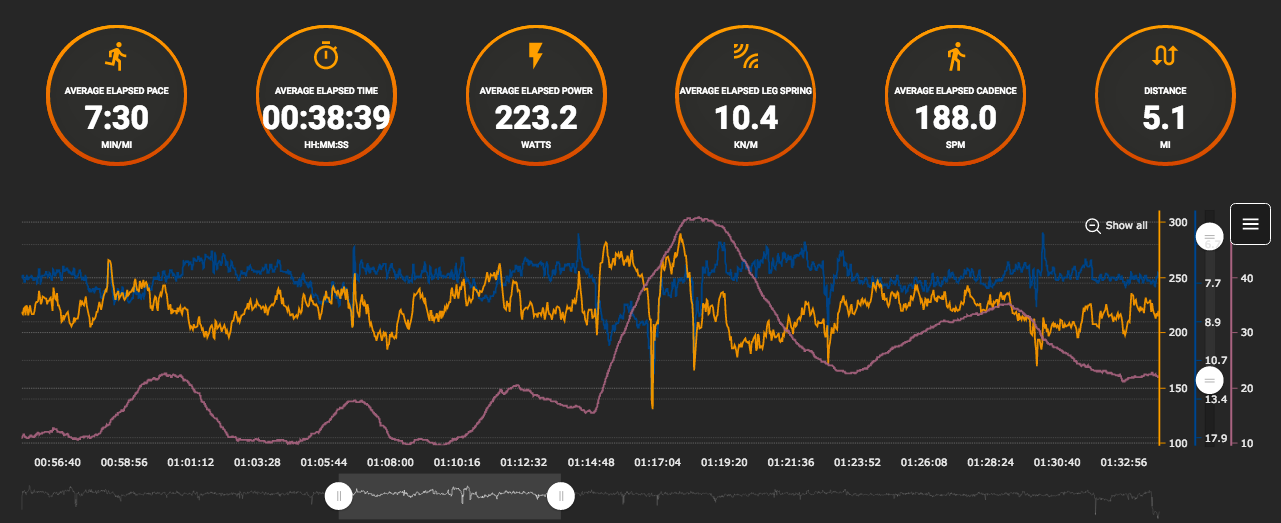
Similarly, this happened all the way around the course on the inclines, and the biggest surge was to run up Palani, which is clearly visible on the power data.
My Power and Pace on Palani
Overall - based on how I felt on the day - I can break down my run in three parts: transition to the downhill after Huggo's, Huggo's to the exit of the energy lab, and the return into town. I remember having to tell myself to keep a lid on the pace after the first few kms. Then settling in a nice rhythm all the way around the Queen K, including the energy lab. And only starting to feel it once I rejoined the Highway, and on the rollers back into town.
Looking at the data, those three stages are roughly visible, especially the drop after the energy lab. Cadence and Leg Spring Stiffness show this better than pace, while power was slowly going down on average.
My Leg Spring Stiffness
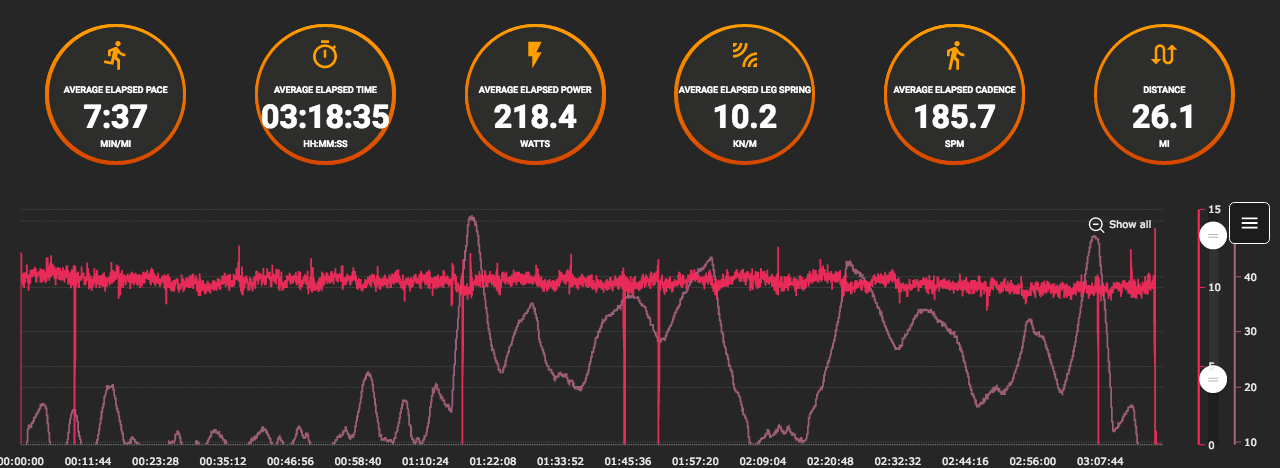
My Cadence
My Power
Looking at some of the pros files, it's clear that although a lot slower, I had a much more even run, so variations are not easy to spot. It felt great and well paced all the way around, and the data clearly shows this. This was an IM marathon PB for me by over 2 minutes, so even if I tired in the end, it was well paced.
The power curve seems to be tracking rather well to the efforts I felt during the run, so this is for me very comparable to working with power on the bike. I am not yet sure how I would use leg spring stiffness as this is a new metric for me. It seems that it would be initially a constant monitoring tool for running improvements, and perhaps fatigue monitoring along the season.
Hopefully, taking part in this trial will help Stryd perfect their product and analysis tools.
Matt Davy lives in Hampton, England. Follow him on Twitter @Ekynoxe, and on Instagram @_ekynoxe
Do you have a Stryd Story that you would like to share? Submit it to adam@stryd.com