
Stryd In Kona: Learn From Top Kona Pros To Race With Power

On October 8th, 2016 more than 2300 of the world’s most elite triathletes converged on the Island of Kona to compete in the iconic Ironman World Championships. Among them were a select few who were the first to run with the new STRYD power meter foot pod. The new STRYD power meter collected information about effort and efficiency that has never been recorded by athletes competing at the championship level.
After swimming 2.4 miles and biking 112 miles, the athletes run 26.2 miles—a marathon—in torturous conditions. Running in the mid-day Hawaii sun, temperatures surged to close to 90 degrees with high humidity and black volcanic rock lining the course only intensifying the heat. Not only are the conditions challenging, but the course itself is unforgiving with rolling hills throughout the second half of the course (Figure 1 purple line). If there was ever a place to test a runner’s resolve and resistance to fatigue, this is it. A good pacing strategy that ensures consistent effort throughout the race is essential for optimal results.

Figure 1. An exemplar of racing data collected by a Stryd device.
Both professional and elite age group triathletes raced with Stryd.
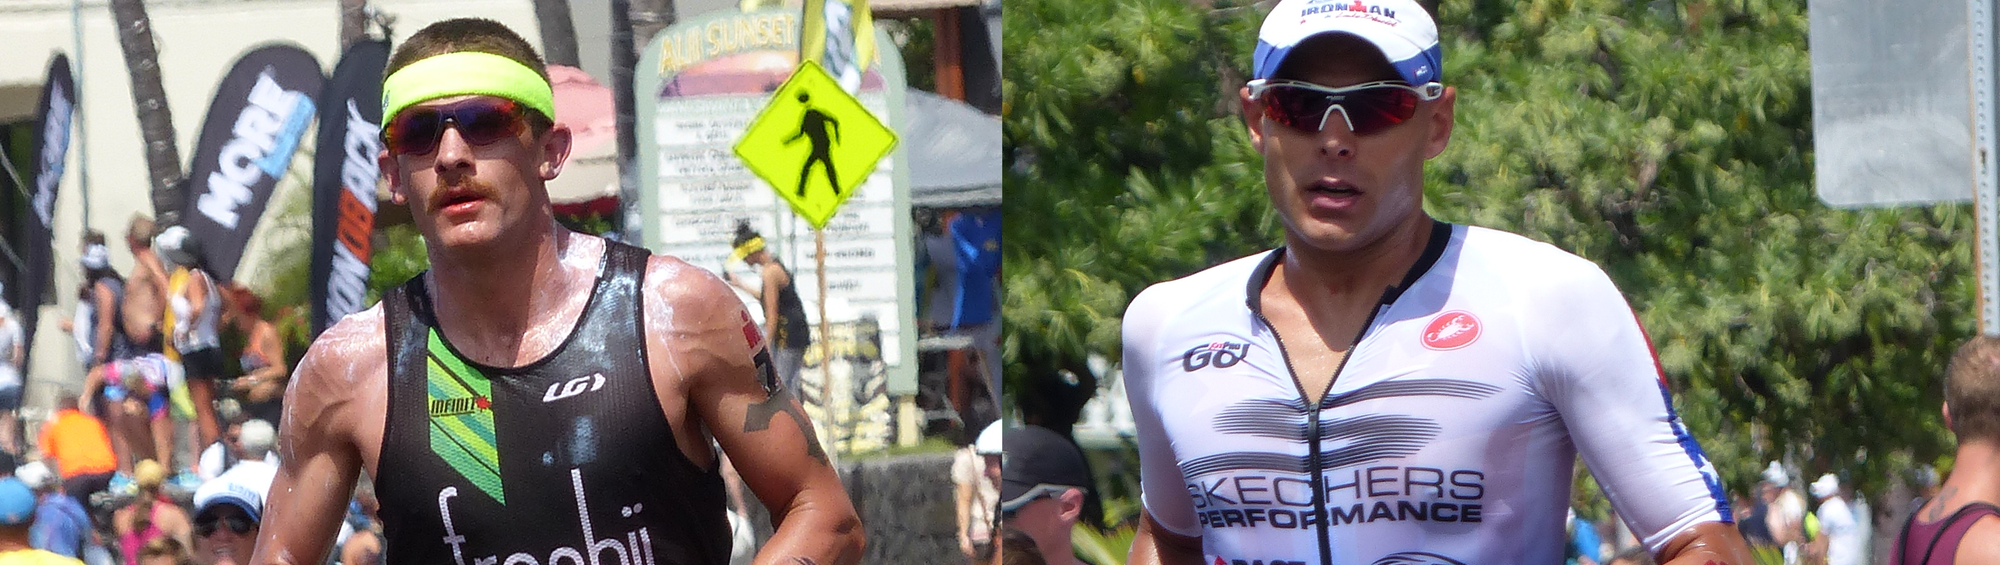
Russell and Sanders

Pro Triathlete, Matt Russell, arrived in Kona fresh off a 3rd place finish at IRONMAN Chattanooga. He had high confidence he could put up another high caliber performance

Pro Triathlete, Lionel Sanders, posted the fastest run among pros at the IronMan 70.3 World Championships one month earlier. He was eager to capitalize on this momentum and post a similar effort in Kona.
The athletes had already raced for close to 5 ½ hours as they transitioned from the bike to the run. Lionel Sanders had pushed hard on the bike and had worked himself up into 13th overall position, a mere 6 minutes behind the leaders. Meanwhile, Matt Russell ran onto the course in 21st place, 9 minutes back from the leaders. The data recorded by Stryd provided insights into the physiological components of the race. We examined their effort and efficiency, while factoring in external variables such as crowd excitement and environment challenges.
Power and Pace
Despite being six and nine minutes behind the leaders, a place on the podium was a realistic possibility for both Lionel Sanders and Matt Russell. Indeed, Patrick Lange, who began the marathon in lock-step with Russell, went on to claim 3rd place overall. However, it took a course-record breaking performance to do so, and he most certainly ran the risk of falling victim to the grueling conditions on the course. Russell resisted the temptation to run with Lange and fell into his own rhythm. This was a crucial moment for him. A consistent pacing strategy is necessary in any marathon, more so in long-course triathlon, and especially in Kona.
The data from STRYD (Figure 2) shows that Russell adjusted his pace (speed in red) judiciously as the terrain varied, while also successfully maintaining a consistent effort (power in W/kg in blue) throughout the entirety of the race. While he didn’t reach his goal of a sub 2:50 marathon, by managing his effort he was able to posted a top-10 marathon split in this World Championship event and gained 13 places over the course or the run for a 12th place finish.

Figure 2. Pace, power, and elevation profile for Matt Russell
Meanwhile, Lionel Sanders (Figure 3) had one of the fastest rides in the field, powering himself from 55th after the swim to 13th entering the run. Only 6 minutes back from the leaders, he was clearly in the mix for a place on the podium. Driven on both by the crowd and by his competitive nature, we see that Sanders started with a strong effort early in the race. The first big test would be the hill on Palani which precedes the lava fields of the Queen K. Highway. It is here that fatigue began to take its toll. While there was a notable drop in power output, we can see that Sanders continued to battle on—his power variability increasing as he continued to ask his body for all that it had. We specifically see increased effort when climbing hills, and seeking some reprieve on descents.

Figure 3. Power and elevation profile: Lionel Sanders
Leg Spring Stiffness
One of the new metrics provided by STRYD is Leg Spring Stiffness (LSS). This is a measure that is tied to overall running economy, based on how well a runner recycles energy. Figure 4 shows the LSS and pace profile for Sanders throughout the race. Very early in the race Sanders’ LSS starts to decline—a clear indication that he was fighting fatigue. Despite this decline he maintains his pace in an effort to stay in podium contention. Yet, the reduction in running economy is eventually insurmountable. After about an hour of running, he must reduce his effort which results in a slower pace.

Figure 4. Stiffness and pace: Lionel Sanders.
Power Variability
When comparing Russell and Sanders, we notice the impact of fatigue on power variability (Figure 5). Power variability is the measure of the difference in instantaneous power and mean power (the solid straight line). Each of them saw increased variability as they fatigued. However, Russell “found” his mean power earlier in the race and was better able to sustain that effort through to the latter stages of the race and minimized his variability overall (0.25 W/Kg). Meanwhile, due to his strong effort early followed by his battle with fatigue in the latter stages of the race Sanders’s power variability (0.50 W/kg) was almost twice as high.
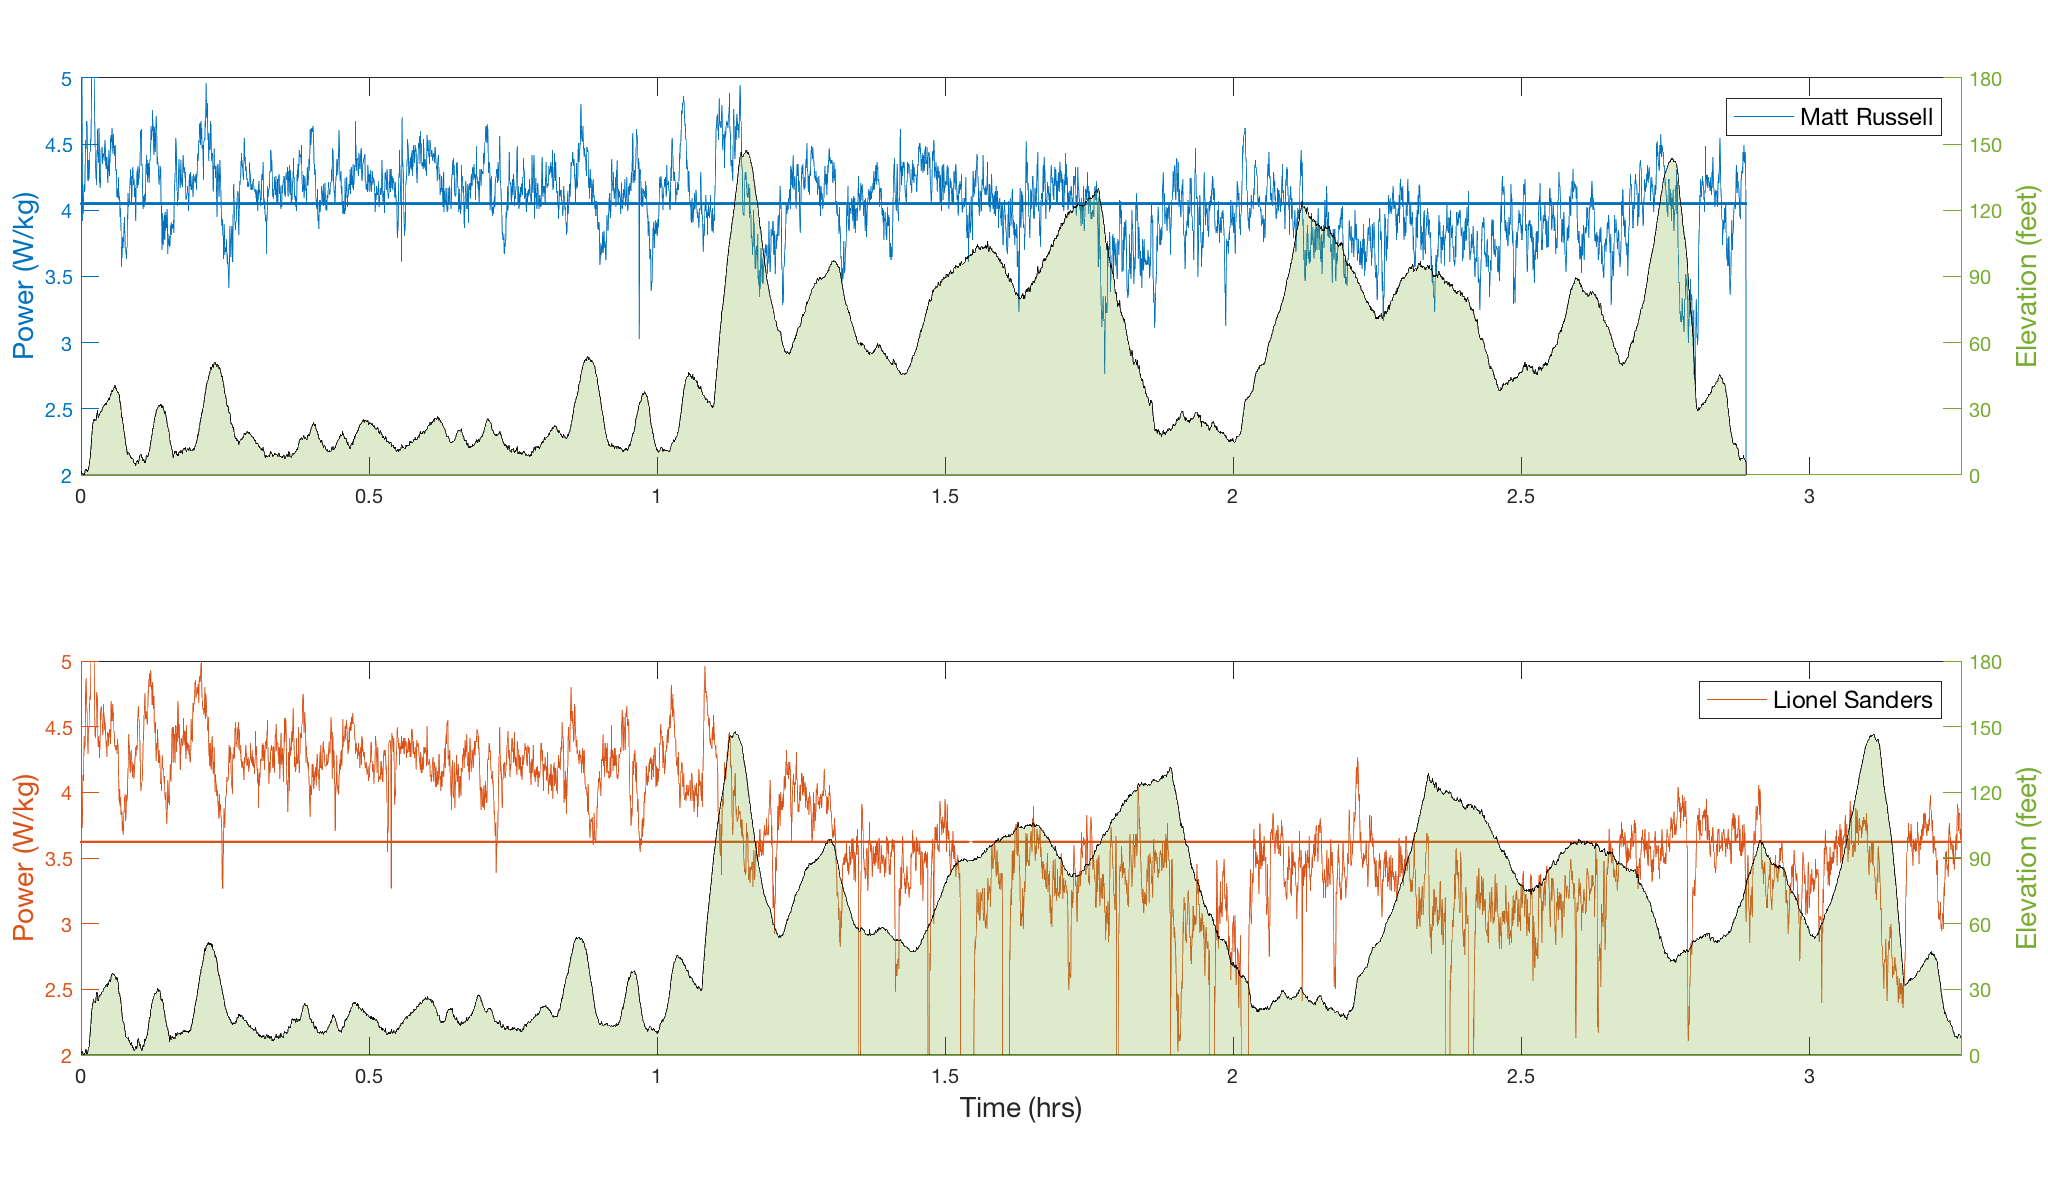
Figure 5: Power and elevation profile: comparison
Lessons Learned
Examining the effort and efficiency data collected by these two elite athletes, we gain insights into performance and fatigue. Maintaining low power variability often results in a faster running. Increased Leg Spring Stiffness is beneficial to running economy and performance. Moreover, declines in an individual’s LSS is a marker of fatigue, and utilizing LSS can provide vital feedback when planning training and even for feedback during competition.
Get your Stryd at https://store.stryd.com
Note: To support better comparison across athletes with different body weights, power is shown in Watts per Kilogram (W/kg)—normalized by body weight.